
1. Introduction
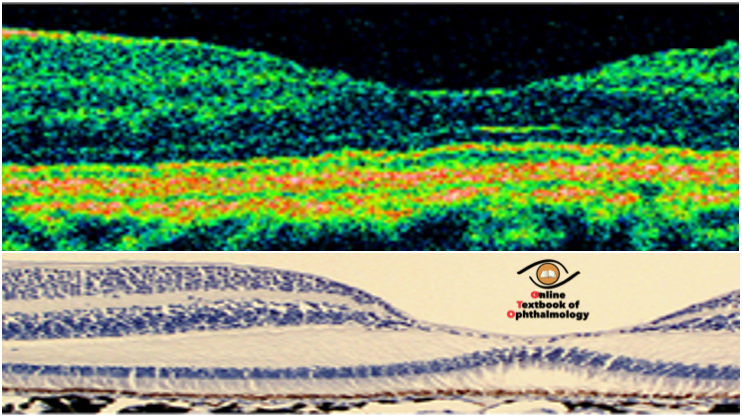
Optical coherence tomography (OCT) is a noninvasive imaging modality that has revolutionized the practice of clinical ophthalmology over the past decade. OCT provides high-resolution cross-sectional images of the retina, optic nerve head and retinal nerve fibre layer (RNFL) unobtainable by any other current modality, and enables qualitative and quantitative evaluation. As opposed to other retinal imaging modalities that provideén faceimages, it provides for sectional information, and in that sense is analogous to an in vivo “optical biopsy”(Figure 1). It is safe, fast, reproducible, does not require greatly skilled technicians, and has minimal, if any, interobserver issues. Several advances in recent times have contributed to vast improvements in resolution and speed of OCT devices, and expanded their applications manifold. In 2010, in the US alone, an estimated 16 million OCT procedures were done, amounting to $ 780 million in reimbursement.[1]
 |
|
Fig 1. Macular OCT with representative histology (Click the image) |
2. Evolution
OCT technology was originally employed in the telecommunications industry to localize faults in fiber optic networks (termed ‘ranging’).[2] A disruption in a fibreoptic cable would reflect back light and low-coherence interferometry would extract time of flight information to enable distance mapping. The first ophthalmic use of this technology was in precision axial length measurements.[3],[4] Low coherence interferometry is the backbone of currently used optical biometric devices like IOLMaster (Carl Zeiss Meditec, Germany), LensStar (Haag Streit AG, Switzerland) and ALScan (Nidek, Japan). Three other developments in the optics-photonics industry contributed significantly to the development of the OCT. The availability ofsuperluminescent diodes(Figure 2)gave a huge boost to OCT development as they represented an excellent low cost and low maintenance light source option. The human eye reflects back less than 1/10000th of light incident on the retina. To overcome the safety issue apparent with increasing retinal illumination to obtain better scan signals,optical heterodyne detectionwas employed. This is a technique to improve detection and interpretation of faint signals. The incorporation ofhigh-speed line camera technologyto enable fast successive repetitive A-scans over a line was essential to scan tissue in a linear pattern and hence obtain 2-dimensional images. James Fujimoto and his group at the Massachusetts Institute of Technology demonstrated the cross-sectional imaging ability of this technology5 by combining data of several 1-D scans (A-scans) to form a 2-D image (B-scan). They were also the first to employ color codes for brightness representation, thereby generating the false colored images we are now so familiar with.
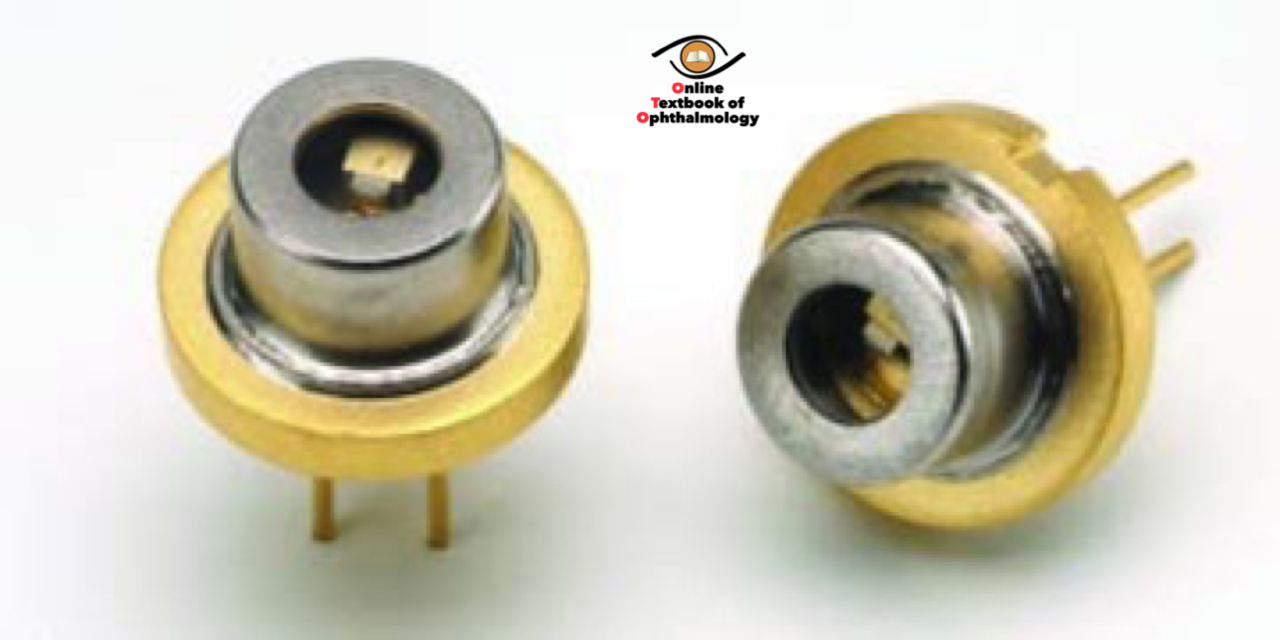 |
| Fig 2. Superluminescent Semiconductor Diodes (Click the image) |
The first commercial OCT system (OCT 1) was introduced by Carl Zeiss in 1996. With minor improvements, a second generation OCT device was introduced in 2000. These devices were slow (100 A-scans/second) and provided limited resolution, resulting in restricted acceptance by the ophthalmology community. However, the third generation OCT device introduced in 2002 (Stratus, Carl Zeiss Meditec) changed the scenario. It offered better speed (400 A-scans/second) and resolution than earlier machines. It gained widespread adoption into ophthalmology and quickly became the standard for clinical trials in retinal diseases. Another major advance in the OCT field (application of Fourier techniques) led to the introduction in 2006, of a much faster device (27,000 A-scans/second) with better resolution (RTVue, OptoVue, USA). This was the first spectral domain OCT (SD-OCT), and was very quickly followed by similar devices from several manufacturers (Cirrus, Carl Zeiss Meditec; Spectralis, Heidelberg Engineering; 3D-OCT, Topcon). The major difference between earlier OCT systems and this generation was the replacement of a moving reference mirror with a fixed one. The movement of the reference mirror placed serious restrictions on the speed of scanning. Commercially available OCT systems today provide imaging with 5μ axial resolution and 10-15μ transverse resolution. Currently, swept-source OCTs (SS-OCT) are being developed and offer even higher scan speeds (>2,50,000 A-scans/second) and resolution than current commercial devices. Coupling adaptive optics with OCT has led to the development of devices with a resolution upto 1μ that can image at the cellular level in vivo.
3. Basics of OCT
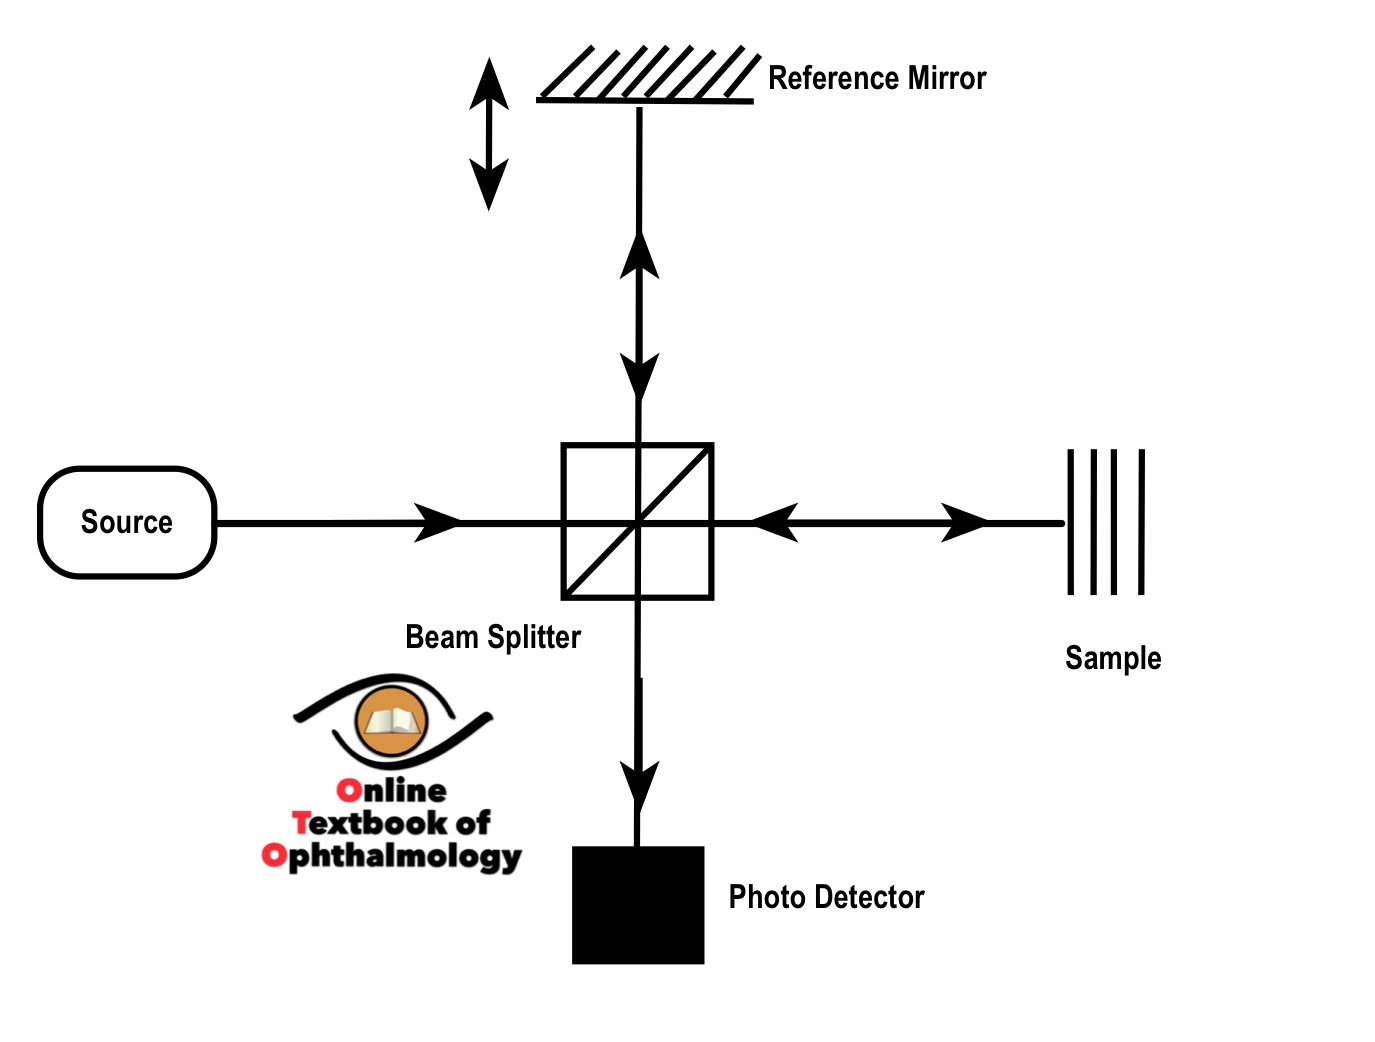
Ocular tissue is made up of layers of differing refractive indices. The interface between these layers represents a discontinuity at which incident light is backscattered. OCT illuminates sample tissue using light from a broadband source and collects backscattered light from the same. In this aspect, it is the optical analogue of ultrasound imaging. Optical signals reflected from backscattering sites carrytime-of-flightandintensityinformation. Optical ranging (from time-of-flight information) tells us from where the signal came from. Intensity of the backscattered signal points to reflectivity of the interface/ tissue. Low coherence interferometry is used to extract these data from reflected signals.
An OCT system(Figure 3,4)consists of a broadband light source(A in Fig 4)connected to a fibreoptic Michelson’s interferometer. Generated light travels to a beam splitter(B in Fig 4), which splits the incident light to two beams. One of these beams illuminates the sample tissue(C in Fig 4)and the other travels to the reference mirror(D in Fig 4). Reflected beams from both return to the beam splitter and the resulting interference pattern is detected by a photo-detector or spectroscope(E in Fig 4). A tissue scanning mechanism moves the scan axis across the sample in a linear fashion. A computer(F in Fig 4)assimilates data from thousands of point scans and processes it to generate linear (two-dimensional)(G in Fig 4)and three-dimensional images.
Images generated by the imaging engine are originally in grayscale. A false color coded representation is presented in the final image to aid with interpretation of reflective intensity. In this color coding, warm colors (red, yellow) represent hyper-reflective tissue and cold colors (blue) represent hypo-reflective tissue. Non-reflective areas (e.g. vitreous, intraretinal fluid) appear as black. Retinal layers are visible as alternating hyper-reflective (plexiform layers) and hypo-reflective (nuclear layers) bands.
 |
|
| Fig 3. Basic OCT principle- Interferometry (Click the image) |
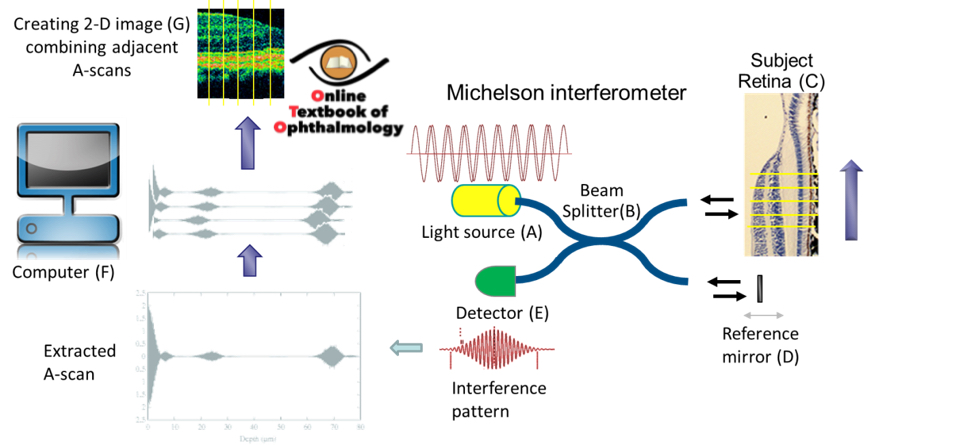 |
| Fig 4. Working OCT Design (Click the image) |
4. Clinical applications
4.1 Interpretation
OCT scanning results in cross-sectional images of the retina unlike angiography or fundus photography. Hence, familiarity with the cross-sectional or ‘histological’ anatomy of the retina greatly facilitates interpretation of OCT images.
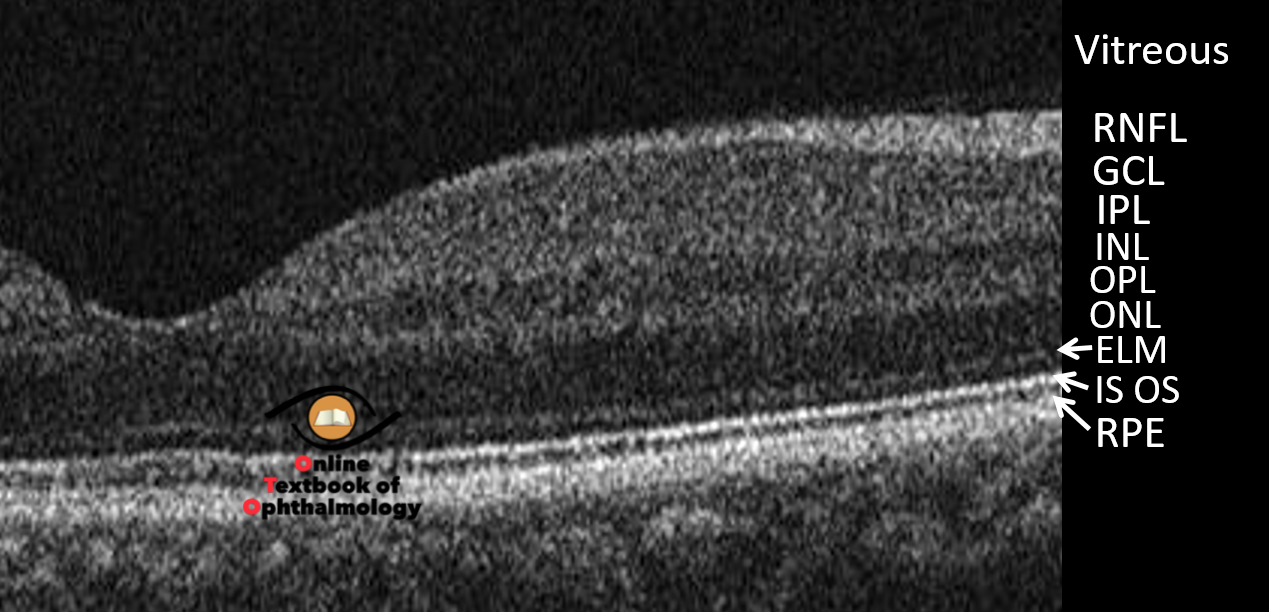
Normal anatomy(Fig 5)
Optically transparent vitreous is invisible and appears as the black (non-reflective) region in the upper part of an OCT image. In cases with some degree of posterior vitreous detachment, the posterior vitreous cortex may be visible as a discrete moderately reflective line (green). The retinal nerve fiber layer (RNFL) appears next, as a hyper-reflective (red) band at the vitreoretinal interface. The RNFL overlies alternating hypo-and hyper-reflective bands of retinal tissue. The hyper-reflective (green) bands represent axonal (mostly horizontal) layers like the plexiform and nerve fiber layers. The hypo-reflective (dark) bands represent nuclear layers and photoreceptor outer segments. A relatively broad (70-80μ) highly reflective layer visible as a thick red line underlying these alternating green and dark bands corresponds to the retinal pigment epithelium (RPE) and choriocapillaris complex. This marks the outer boundary of the retina and is used as a landmark for calculation of retinal thickness. Immediately above this RPE-choriocapillaris complex, and separated from it by a hypo-reflective band signifying photoreceptor outer segments, is a thin hyper-reflective red line that represents the inner segment- outer segment (IS-OS) junction. Above this layer, a moderately reflective line may be seen frequently and signifies the location of the external limiting membrane (ELM). Together, the ELM, IS-OS junction, photoreceptors and RPE constitute the outer retinal layers and are of great prognostic importance in a range of retinal diseases. At the fovea, only the outer nuclear layer overlies the photoreceptors.
 |
| Figure 5. Normal cross sectional retinal anatomy on SD-OCT (Click the image) |
The choroid underlying the RPE-choriocapillaris complex is visible as voids interspersed with mildly hyper-reflective tissue. The voids represent the medium and large choroidal vessels. In routine OCT, the choroidal signal fades away rapidly without a distinct posterior boundary. Where enhanced depth imaging (EDI) is employed, the choroidal outer boundary (inner sclera) may be visualized, enabling quantification of choroidal thickness.
Pathoanatomy
Retinal pathology can create a range of structural alterations in the normal architecture that can be recognized on OCT images by their configuration, location and reflective properties. Awareness of the optical properties of tissue likely to be present in the area of scanning is essential. Transudate or fluid accumulation reduces reflectivity of tissue and, when localized, results in an optical void. Blood, hard exudates, pigment and fibrous tissue are hyper-reflective and when sufficiently thick, may not allow scan beams to pass through, resulting in shadowing out of underlying structures. RPE atrophy may result in less backscattering at this layer with enhanced signal from the underlying choroid.
Fluid accumulation is a result of a variety of pathologies from central serous chorioretinopathy (CSCR) to diabetic macular edema. Areas with fluid accumulation exhibit increased retinal thickness. When intraretinal, this fluid leads to optical rarefaction or cyst formation(Fig 6A, B). When a distinct optical void is present between the neurosensory retina and the RPE, it represents subretinal fluid (SRF) or neurosensory detachment(Fig 6C). When an optical void is present underlying the RPE band, it signifies pigment epithelial detachment (PED)(Fig 6D).
 |
| Figure 6. Appearance of fluid on OCT images, A: optical rarefaction (*); B: cyst formation (CME) (*); C: subretinal fluid (SRF) or neurosensory detachment (*); D: Pigment epithelial detachment (PED) (*) (Click the image) |
Less-than-normal retinal thickness measurements are a result of atrophy or abiotrophy. The loss in retinal thickness may be more pronounced in the inner retina (as in vascular occlusions) or outer retina (long standing CSCR or retinal dystrophies). There can be discontinuity in the retinal tissue at the fovea, which may be partial (signifying lamellar macular hole) or complete down to the RPE (full thickness macular hole). ‘Extra’ tissue may be present overlying the retina (fibrovascular proliferation, epiretinal membranes) or underlying it (choroidal neovascular membranes). Image contours can also present evidence of dynamic forces (pull, as in vitreomacular traction; push, as in choroidal tumors) acting on the retina.
4.2 Retina
4.2.1 Vitreoretinal interface disorders
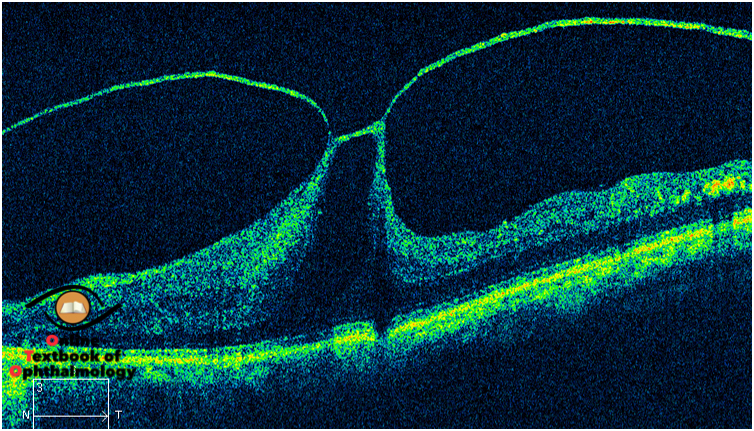
Posterior vitreous detachment (PVD), when limited or macular in nature can be visualized on the OCT image as a thin green line of posterior vitreous cortex. With complete PVD, the posterior vitreous cortex moves too anteriorly to be imaged in one frame with the retina. Vitreoschisis can be identifies as double or multiple linear shadows of moderate reflectivity. Vitreomacular traction(Fig 7)is caused by continued pathologic adherence of the vitreous at the macula in the setting of a perifoveal vitreous detachment or vitreoschisis leading to traction, macular distortion and cystoid macular edema (CME).[6][7][8] OCT demonstrates a V-shaped posterior hyaloid, attached at the fovea and detached temporal and nasal to it. The vitreous may be adherent at the optic disc and along the arcades in these cases. There may be associated epiretinal membranes (ERM), CME, intraretinal splitting or a tractional foveal detachment. Surgery is usually successful in releasing the traction and reversing the anatomical derangement, with improvement in vision in most cases.
 |
|
Figure 7. Vitreomacular traction (Click the image) |
Epiretinal membranes, either idiopathic or secondary to intraocular inflammation, retinal vascular disease, or postoperative, occur in 2.2% to 18.5%of the population.[9],[10],[11],[12],[13] An ERM is visible on the OCT image as a taut hyper-reflective line contiguous with or anterior to the inner retinal surface.[14] The ERM may be globally adherent or have varying degrees of separation from the inner retina (Fig 8). ERMs may result in loss of the foveal contour, irregularity and corrugation of the inner retinal layers, and macular thickening. All these changes are clearly characterized on the sectional image provided by the OCT. The status of the outer retinal structures (photoreceptor layer, IS-OS junction, ELM) may have prognostic significance in cases where ERM surgery is indicated.[15],[16],[17],[18]
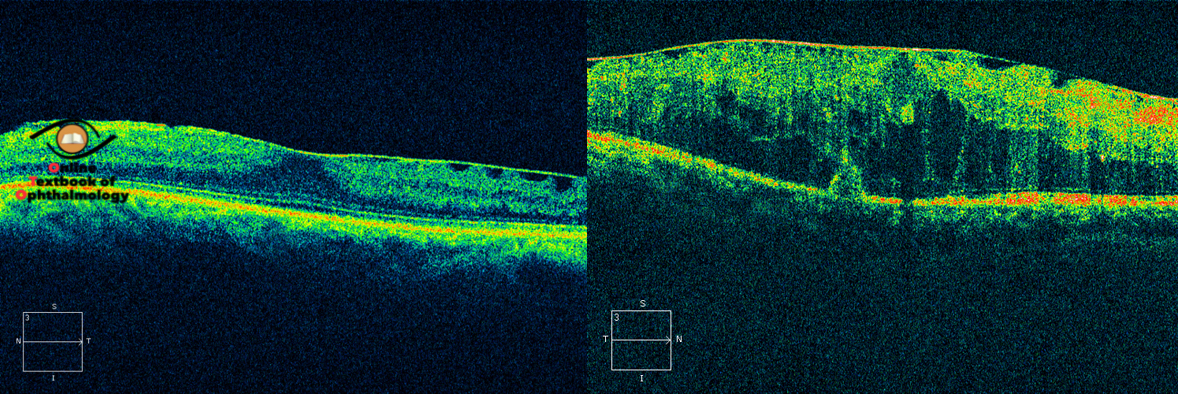 |
| Figure 8. Epiretinal membranes (Left, with minimal retinal thickening; Right, Macular edema) (Click the image) |
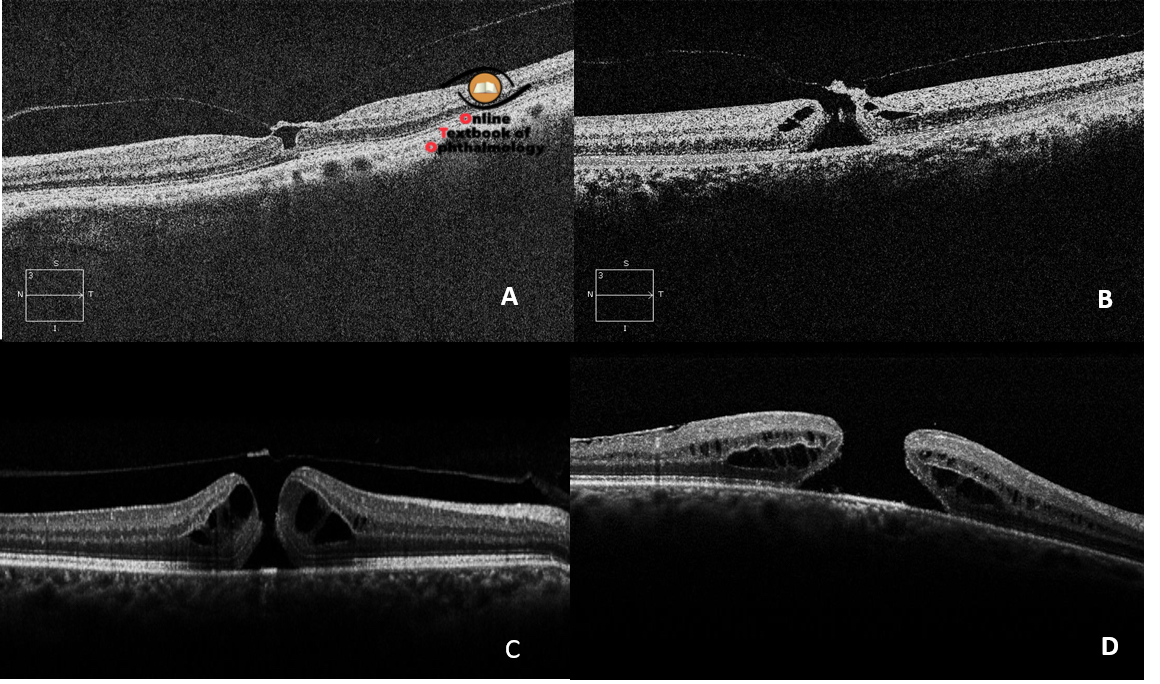
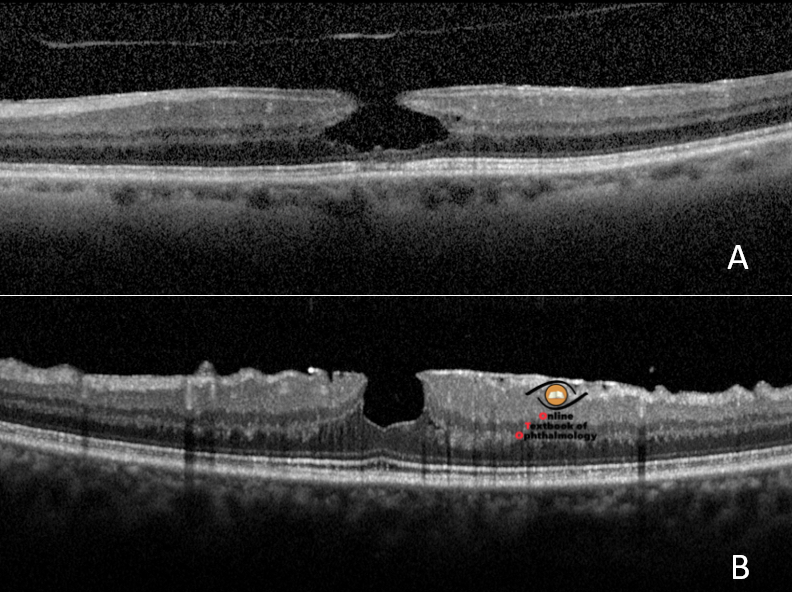
OCT has contributed vastly to the understanding and management of idiopathic full thickness macular holes. The traction theory of formation of macular holes and their stages, proposed by Gass,19,20 has been reinforced and supplemented by OCT imaging(Fig 9,A toD).[21],[22][23] It has been demonstrated on OCT that macular hole formation proceeds through successive stages, the first event being perifoveal PVD with persistent vitreofoveal adhesion causing traction on the fovea. This is followed by foveal cyst formation (occasionally with foveal detachment), which may progress to full-thickness retinal defect or a lamellar defect or to spontaneous resolution with complete vitreofoveal separation.[24][25] OCT is indispensable in the preoperative assessment of full-thickness macular holes for accurate staging, measurement of hole dimensions and derivation of several indices and assessment of retinal architecture.[26][27][28][29] These serve as useful predictive factors for macular hole surgery. Postoperative assessment of macular hole closure can be characterized on OCT imaging.[30] SD-OCT has also enabled correlation of outer retinal morphological features with visual outcome in eyes with surgically closed idiopathic macular hole.[31][32][33]
 |
|
Figure 9. Idiopathic Macular Hole. A: Stage 1- Foveal pseudocyst; B: Stage 2- Full thickness macular hole (FTMH) with foveal vitreous attachment; C: Stage FTMH with operculum and limited PVD (note papillary vitreous attachment); D: Stage 4- FTMH with complete PVD (Click the image) |
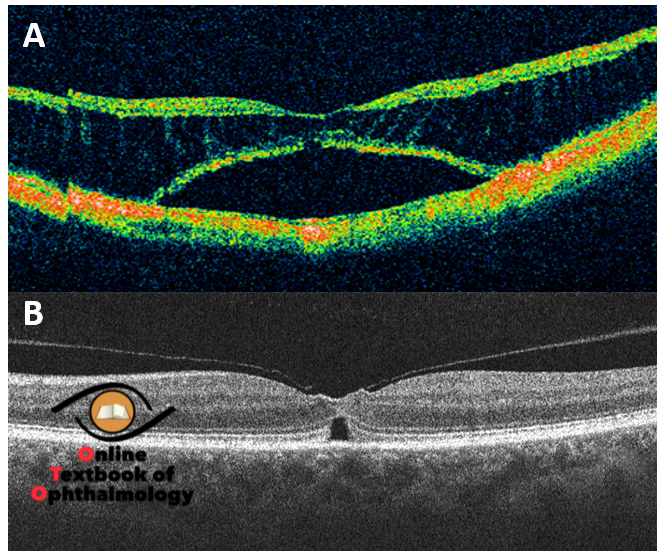
Lamellar macular holes (LMH) are partial thickness defects in the inner retina probably caused by a combination of oblique traction of vitreous and tangential tractional force of overlying ERM. On OCT images, LMH is seen as a partial-thickness defect of the inner retina, with an irregular foveal contour and reduced foveal thickness, intact outer retinal layers at the base of the hole, and a splitting of the inner from the outer retinal layers surrounding this defect(Fig 10A).[34] A large number of these are associated with ERMs. Lamellar holes, when symptomatic, are amenable to surgical correction.[35] Macular pseudoholes are a distinct entity with a clinical appearance of a sharply defined reddish area at the fovea mimicking a macular hole. On OCT imaging, pseudoholes display a steep fovea contour, surrounding ERM and a normal or slightly increased central and paracentral retinal thickness. There is no retinal defect and no disturbance of outer retinal structures(Fig 10B). OCT is an invaluable tool in distinguishing these clinically similar macular pathologies.
 |
|
| Figure 10. A: Lamellar Macular Hole; B: Pseudohole (Click the image) |
4.2.2 Intraretinal disorders
Macular edema is an integral manifestation of several retinal pathologies. Vascular retinopathies (diabetic retinopathy, vein occlusions), inflammatory conditions (post-operative, posterior or intermediate uveitis), pharmacologic agents and hereditary retinal degenerations can result in retinal thickening at the fovea that is clinically visible. However, the best characterization of macular thickening is possible only on OCT imaging(Fig 11), and this is now the standard of care in the management of these patients. Sectional images reveal internal morphology of the retinal edema, from diffuse thickening to cystoid and schitic pattern, which have been found to correlate with retinal sensitivity loss.[36] Quantification of retinal thickness and volume can be performed and has become the gold standard in all clinical trials on macular edema. Temporal trends and treatment effects can be evaluated on serial scans. Changes on OCT may indicate initiation or cessation of treatment for macular edema. The OCT is particularly invaluable in the diagnosis and management of cases with non-clinically significant macular edema and mild macular thickening.
Retinal dystrophies and degenerations have distinct features on the OCT depending upon the stage of the disease. Retinitis pigmentosa and some dystrophies presents with retinal thinning.[37] In most of these conditions, the outer retinal layers are mainly affected, especially the outer nuclear layer, photoreceptor layer and IS OS junction.[38-40] Choroidal thinning, apparent on enhanced depth OCT imaging, is a feature of some of these dystrophies.[41],[42] Vitelliform dystrophies present with increased retinal thickness initially with intact outer retinal layers. [43],[44]
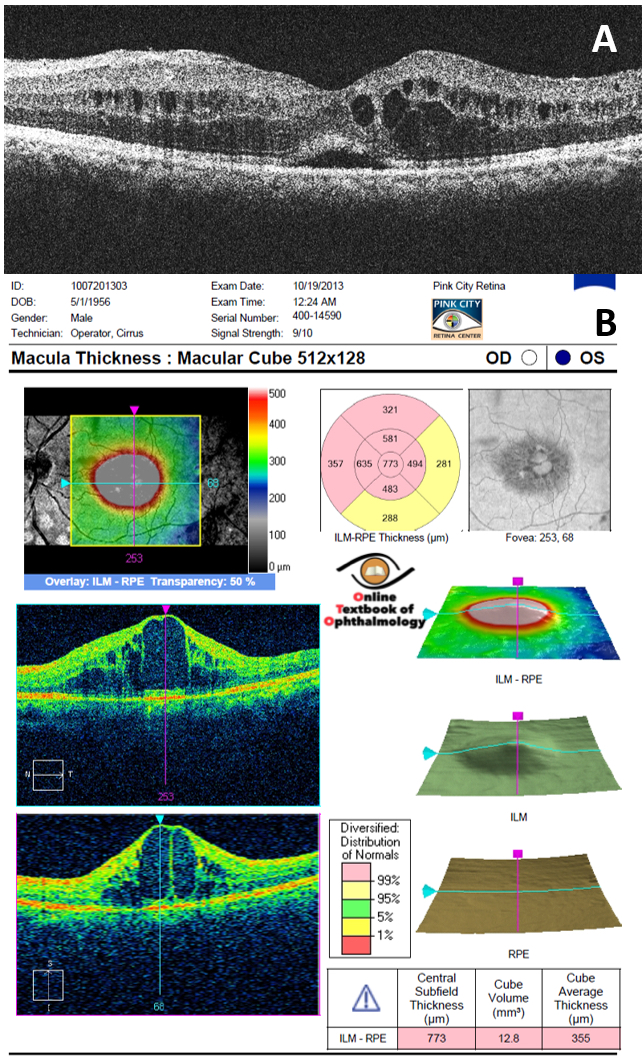 |
| Figure 11. Without high resolution cross-sectional imaging, it is challenging to characterize fluid accumulation in the retina, quantify it or segregate its components. A: The macular edema has mixed morphology with a combination of spongiform and cystoid edema and neurosensory detachment; B: Retinal Thickness Parameters(Click the image) |
Drug toxicities may be detected at an early stage using SD-OCT. Hydroxychloroquine toxicity reveals parafoveal loss of the inner segment-outer segment and cone outer segment tip lines at early stages of toxicity leading to a dipping of the overlying ELM and retinal layers in this region. [45],[46] The changes are most marked about 1 mm from the fovea.[47] OCT changes may progress to parafoveal thinning of the outer nuclear layer and eventually to retinal pigment epithelium damage. OCT assessment of parafoveal retinal thickness48 and architecture is an important investigation along with 10-2 visual fields in patients on long term antimalarials.
OCT imaging is very useful in the detection of myopic foveoschisis and macular microholes, conditions otherwise extremely difficult to diagnose clinically or with conventional imaging(Fig 12). OCT imaging has also been applied to image retinal lesions away from the macula.[49] It may be employed in detecting subclinical lesions and assist in decision making in clinical dilemmas.
 |
| Figure 12. Visual loss with normal foveal contour. A: Myopic foveoschisis; B: Macular microhole(Click the image) |
4.2.3 Subretinal pathologies
OCT is invaluable in the management of AMD patients. OCT assessment can detect subtle disease activity before clinical examination can. On OCT images, a choroidal neovascular membrane is visible as a focal or broad area of thickened RPE- choriocapillaris complex with local fluid accumulation, either intraretinal or subretinal. Broad areas of hyperreflectivity overlying the RPE band may give an impression of reduplication of the RPE(Fig 13A). Hemorrhages appear as hyper-reflective areas with shadowing beneath the same. PEDs appear as dome shaped elevation of RPE choriocapillaris band. When serous in nature, the underlying choroid signal is visible below the PED. Hemorrhagic PEDs present with shadowing out of the underlying structures(Fig 13B). Disruption of outer retinal structures and choroid alterations can be better appreciated and documented with OCT imaging.[50],[51] VMT is often noted in cases of wet AMD. [52],[53] The ability to detect the presence of even the smallest traces of subretinal and intraretinal fluid on cross sectional images has made OCT a vital tool in decision making. Treatment regimens based on OCT have proven to be very effective in preserving vision in patients with wet AMD.[54],[55] It has been demonstrated that manual qualitative assessment of OCT images may represent the preferred method to assess leakage in wet AMD without relying on the machine56 or absolute central macular thickness values to base decision making upon. Automatic retinal layer identification and segmentation (on which retinal thickness measurements depend) is often erroneous in AMD cases. Drusen can be appreciated on OCT as irregular undulations or bumps of the RPE complex(Fig 13C). Focal hyper-reflectivity over the drusen may be correlated to RPE atrophy. Areas with geographic atrophy display loss of the RPE hyper-reflective band with increased choroidal reflectivity, and disruption of the IS OS junction and ELM. The Bruch’s membrane, normally indistinguishable on OCT from RPE in pigmented eyes, may be seen prominently.[57]
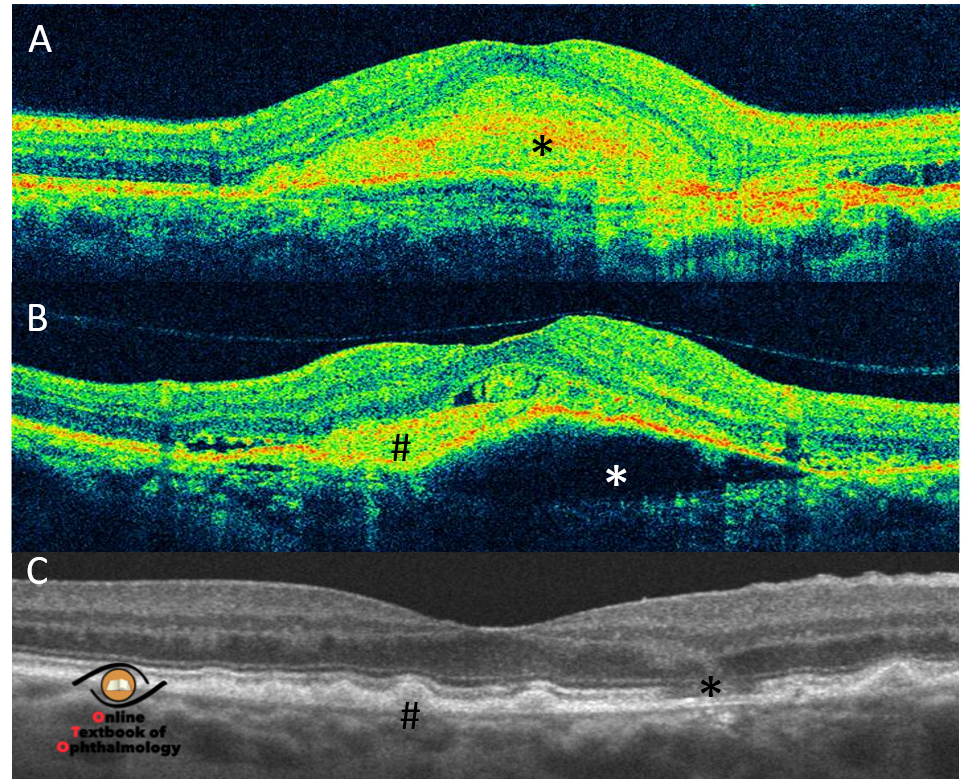 |
| Figure 13. OCT in AMD. A: Choroidal neovascular membrane. Note ‘reduplication’ of RPE (*); B: Hemorrhagic PED (*) with subretinal CNVM (#); C: Dry AMD with Drusen (#) and Geographic atrophy (*)(Click the image) |
Central serous chorioretinopathy (CSCR) is seen on OCT as a dome shaped elevation of neurosensory retina. In acute CSCR, the retinal architecture is well preserved. In long standing CSCR, overlying retina shows cystoid spaces and thinning on OCT. PEDs and fibrin may be seen underlying the retinal elevation. OCT is useful in monitoring patients’ progress while waiting for spontaneous resolution, if observation has been opted. It is also valuable in detecting subtle fluid in chronic cases(Fig 14).
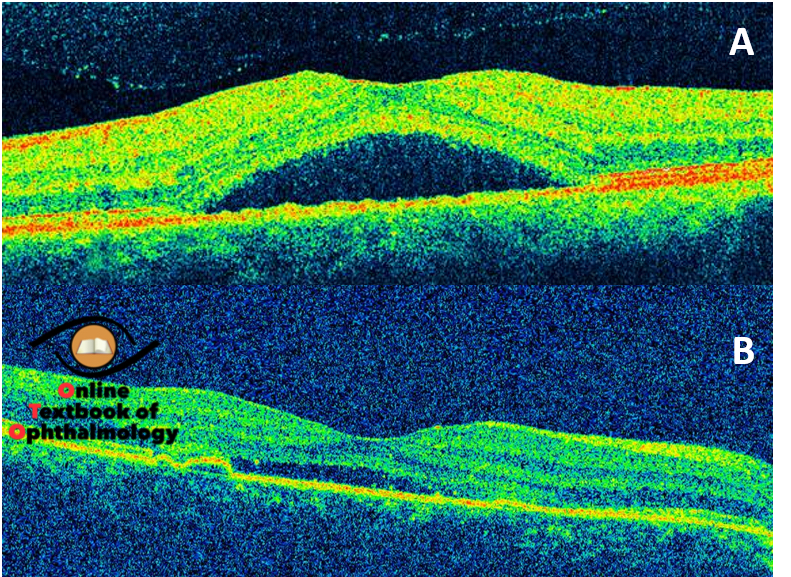 |
| Figure 14. Central Serous Retinopathy. A: Acute, with intact retina overlying the SRF pocket; B: Chronic CSR with thinned retina and subtle, clinically unapparent subretinal fluid(Click the image) |
4.3 Glaucoma
Identification of structural optic nerve damage is crucial in the diagnosis of glaucoma and monitoring its clinical course.[58] OCT provides objective, reproducible, automated, quantitative measurements of the optic nerve head and RNFL thickness. Software on the OCT recognizes landmarks to map out the optic nerve head (ONH) and the RNFL. Measurements, such as rim and cup area and vertical and horizontal cup-disc ratio are then presented along with quantitative measurements of RNFL thickness in every clock hour. The OCT system also provides a statistical comparison of test values to the population normative database, and depicts these in a color-coded format for easy recognition of abnormalities (Fig 15). OCT can detect RNFL abnormalities that often exist in eyes with early glaucoma with normal standard automated perimetry.[59],[60] RNFL thickness is better than ONH parameters in the detection of preperimetric glaucoma, and rim area is similar to average RNFL thickness in the diagnosis of advanced glaucoma.[61],[62] OCT compares favorably to confocal scanning laser ophthalmoscope and scanning laser polarimetry in discriminating between normal eyes and glaucomatous eyes.[63],[64] Longitudinal follow-up of glaucoma progression is possible using software available on OCT systems.[65],[66] However, there is insufficient long-term evidence as to the validity or superiority of using any particular software as OCT systems have evolved rapidly in the last few years, resulting in inadequate follow-up of patients on the same system. Currently, the standard of care in glaucoma management is clinical assessment coupled with one or more of the ONH structural imaging modalities.[67] Additionally, it is not recommended to use OCT for general population glaucoma screening. [68]
Recently, interest has been generated in macular imaging for glaucoma detection. The limitation imposed on retinal layer segmentation by earlier generation OCT due to their low resolution has been offset by the newer SD-OCTs. Ganglion cell layer- inner plexiform layer (GCL-IPL) and ganglion cell complex (GCC=GCL-IPL+ macular RNFL) measurements have been actively investigated in the diagnosis of glaucoma(Fig 15). The diagnostic capability of GC-IPL has been found comparable with RNFL, and minimum GCIPL has been reported to be the most sensitive for the diagnosis of glaucoma.[69],[70],[71],[72] Regional GCL-IPL measures have performed as well as regional RNFL measurements for detection of earlyglaucoma, though average RNFL thickness performed better than average GCL-IPL measures.[73] Though ganglion cell measurements offer good diagnostic capability in detection of early glaucoma, they miss abnormal findings in glaucomatous eyes when RNFL defects the angular distance between fovea and RNFL defect is great (e.g. wedge defect near the arcades).[74] Currently, peripapillary RNFL measurements represent the most reliable of the structural parameters measured on OCT across the glaucoma spectrum.[75]
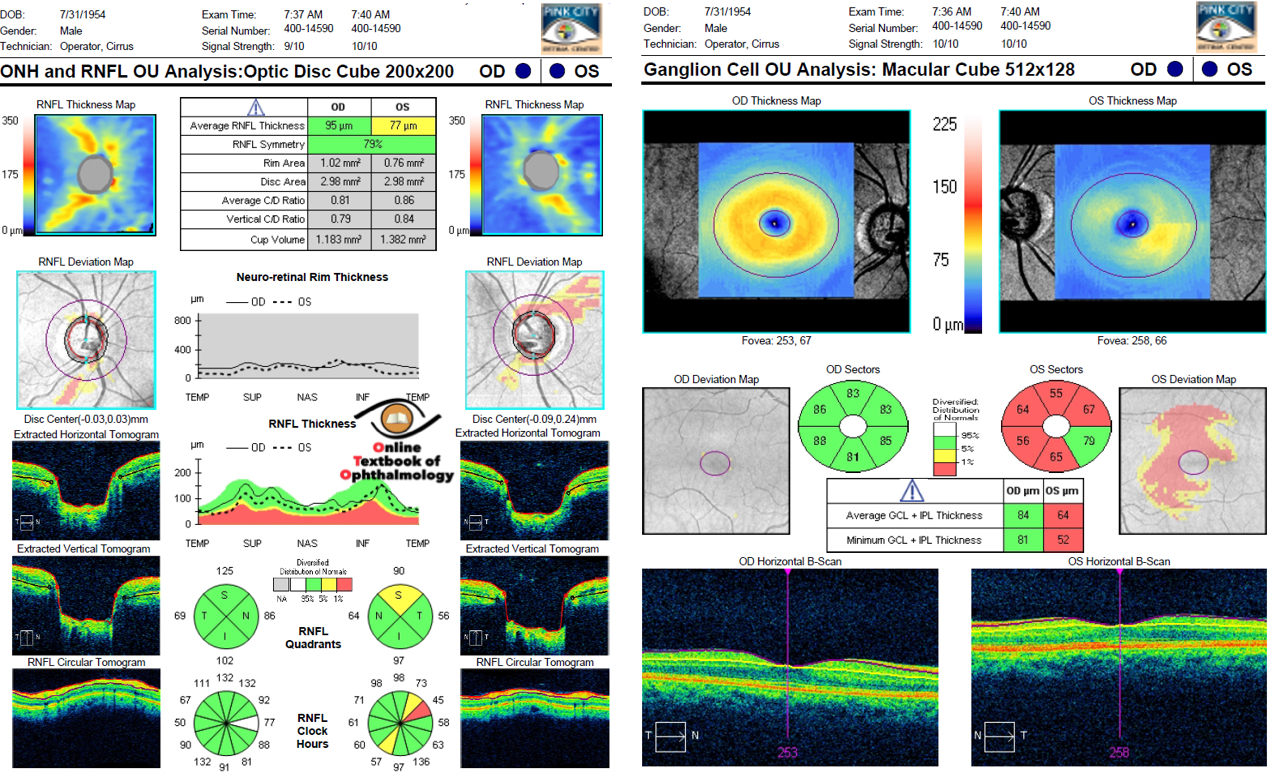 |
| Figure 15. OCT in Glaucoma. Left, ONH parameters and RNFL map with analysis; Right, Macular GCL+IPL map(Click the image) |
4.4 Anterior segment
SD-OCT devices available today are capable of anterior segment imaging, though to a limited extent. Some devices need additional lenses for anterior scanning, whereas others have inbuilt adjustments for the same. Sectional images of the cornea are useful for corneal thickness assessment and for visualizing stromal pathology, e.g. after laser in situ keratomilieusis at the flap interface. Standard OCT has also been used to assess the anterior chamber angle but has little value as it requires extrapolation. This is because the scanning beam of routine OCTs (830 nm) cannot penetrate tissue beyond the scleral spur. Visante OCT (Carl Zeiss Meditec, Dublin, CA) uses longer wavelength scanning beams and is superior for the assessment of the anterior segment. Phakic lenses can also be monitored using the OCT.
5. Future directions
The field of medical OCT is progressing rapidly, with the introduction of several innovative and powerful technologies. A recent application of existing OCT technology has been the integration of the OCT system to the operating microscope. This enables intraoperative OCT assessment of the macula during delicate macular surgery. A portable handheld OCT is also available for imaging the retina in supine patients. It is of particular use in pediatric population for imaging under anesthesia. OCTs with Doppler flow measurement ability are now available for clinical use. Poised to enter the clinical ophthalmology field are faster machines that use swept-source lasers for scanning (enabling very high scanning speeds and better resolution) and OCTs that employ longer wavelength light sources for better penetration and choroidal visualization. Multimodality integration is being attempted at several research centers to enable even more efficient utilization of OCT systems. Adaptive optics OCTs with cellular level resolution are already being utilized for experimental work. Better computational techniques and improved software for better segmentation continues to be developed.
6. Conclusions
Optical coherence tomography is a valuable clinical tool for the diagnosis and management of retinal diseases and glaucoma. Its use has enable better understanding, diagnosis, decision making and management in a wide variety of conditions. Ophthalmic practice continues to be enriched and refined by the wealth of knowledge coming out of OCT imaging, and several management paradigms in ophthalmology are now based upon information provided by OCT. The indications and applications of OCT continue to expand as experience grows and better technology becomes available. Major technological advances in OCT are certain to impact research and clinical practice in ophthalmology in the future.
References:
- Swanson EA , Huang D. Ophthalmic OCT Reaches $1 Billion Per Year. Retinal Physician, May 2011
- Takada K, Yokohama I, Chida K, Noda J. New measurement system for fault location in optical waveguide devices based on an interferometric technique. Appl. Opt. 1987; 26: 1603–1606
- Youngquist RC, Carr S, Davies DEN. Optical coherence domain reflectometry: a new optical evaluation technique. Opt. Lett. 1987; 12: 158–160
- Fercher AF, Mengedoht K, Werner W. Eye-length measurement by interferometry with partially coherent light. Opt. Lett.1988; 13: 186–188
- Huang D, Swanson EA, Lin CP et al. Optical coherence tomography. Science 1991; 254: 1178–81
- Gass JDM. Macular dysfunction caused by vitreous and vitreoretinal interface abnormalities. In: Gass JDM. Stereoscopic Atlas of Macular Diseases: Diagnosis and Treatment. 4th ed. St Louis, MO: Mosby-Year Book, Inc; 1997: 903–914
- Hikichi T, Yoshida A, Trempe CL. Course of vitreomacular traction syndrome. Am J Ophthalmol. 1995;119(1):55–61
- Gallemore RP, Jumper JM, McCuen BW, et al. Diagnosis of vitreoretinal adhesions in macular disease with optical coherence tomography. Retina 2000;20(2): 115–120
- Ng CH, Cheung N, Wang JJ, et al. Prevalence and risk factors for epiretinal membranes in a multi-ethnic United States population. Ophthalmology. 2011;118(4):694–699
- Klein R, Klein BE, Wang Q, Moss SE. The epidemiology of epiretinal membranes. Trans Am Ophthalmol Soc. 1994;92:403–425
- Legarreta JE, Gregori G, Knighton RW, et al. Three-dimensional spectral-domain optical coherence tomography images of the retina in the presence of epiretinal membranes. Am J Ophthalmol. 2008;145(6):1023–1030
- Mori K, Gehlbach PL, Sano A, Deguchi T, Yoneya S. Comparison of epiretinal membranes of differing pathogenesis using optical coherence tomography. Retina. 2004;24(1):57–62
- Wilkins JR, Puliafito CA, Hee MR, et al. Characterization of epiretinal membranes using optical coherence tomography. Ophthalmology. 1996;103(12):2142–2151
- Arevalo JF, Lasave AF, Arias JD, et al. Clinical applications of optical coherence tomography in the posterior pole: the 2011 José Manuel Espino Lecture - Part I. Clin Ophthalmol 2013:7 2165–2179
- Mitamura Y, Hirano K, Baba T, Yamamoto S. Correlation of visual recovery with presence of photoreceptor inner/outer segment junction in optical coherence images after epiretinal membrane surgery. Br J Ophthalmol. 2009;93(2):171–175
- Suh MH, Seo JM, Park KH, et al. Associations between macular findings by optical coherence tomography and visual outcomes after epiretinal membrane removal. Am J Ophthalmol. 2009;147(3):473–480
- Michalewski J, Michalewska Z, Cisiecki S, Nawrocki J. Morphological functional correlations of macular pathology connected with epiretinal membrane formation in spectral optical coherence tomography (SOCT). Graefes Arch Clin Exp Ophthalmol. 2007;245(11):1623–1631
- Oster SF, Mojana F, Brar M, et al. Disruption of the photoreceptor inner segment/outer segment layer on spectral domain-optical coherence tomography is a predictor of poor visual acuity in patients with epiretinal membranes. Retina. 2010;30(5):713–718
- Gass JDM. Idiopathic senile macular holes: its early stages and pathogenesis. Arch Ophthalmol. 1988;106(5):629–639
- Gass JDM. Reappraisal of biomicroscopic classification of stages of development of a macular hole. Am J Ophthalmol 1995; 119: 752–759
- Johnson MW. Improvements in the understanding and treatment of macular hole. Curr Opin Ophthalmol. 2002; 13(3):152–160
- Hassenstein A, Scholz F, Richard G. [OCT in macular holes]. Ophthalmologe. 2004;101(8):777-84
- Altaweel M, Ip M. Macular hole: improved understanding of pathogenesis, staging, and management based on optical coherence tomography. Semin Ophthalmol. 2003; 18(2):58–66
- Haouchine B, Massin P, Gaudric A. Foveal pseudocyst as the first step in macular hole formation: a prospective study by optical coherence tomography. Ophthalmology. 2001;108(1):15–22
- Takahashi A, Nagaoka T, Ishiko S, Kameyama D, Yoshida A. Foveal anatomic changes in a progressing stage 1 macular hole documented by spectral-domain optical coherence tomography. Ophthalmology. 2010; 117(4):806-10
- Ullrich S, Haritoglou C, Gass C, et al. Macular hole size as a prognostic factor in macular hole surgery. Br J Ophthalmol. 2002;86(4):390–393
- Kusuhara S, Teraoka Escaño MF, Fujii S, et al. Prediction of postoperative visual outcome based on hole configuration by optical coherence tomography in eyes with idiopathic macular holes. Am J Ophthalmol. 2004; 138(5):709-16
- Ruiz-Moreno JM, Staicu C, Piñero DP, et al. Optical coherence tomography predictive factors for macular hole surgery outcome. Br J Ophthalmol. 2008; 92(5):640-4
- Wakely L, Rahman R, Stephenson J. A comparison of several methods of macular hole measurement using optical coherence tomography, and their value in predicting anatomical and visual outcomes. Br J Ophthalmol. 2012; 96(7):1003-7
- Kang SW, Ahn K, Ham DI. Types of macular hole closure and their clinical implications. Br J Ophthalmol. 2003; 87(8):1015-9
- Wakabayashi T, Fujiwara M, Sakaguchi H, Kusaka S, Oshima Y. Foveal microstructure and visual acuity in surgically closed macular holes: spectral-domain optical coherence tomographic analysis. Ophthalmology. 2010; 117(9):1815-24
- Ooka E, Mitamura Y, Baba T, et al. Foveal microstructure on spectral-domain optical coherence tomographic images and visual function after macular hole surgery. Am J Ophthalmol. 2011; 152(2):283-290
- Itoh Y, Inoue M, Rii T, Hiraoka T, Hirakata A. Significant correlation between visual acuity and recovery of foveal cone microstructures after macular hole surgery. Am J Ophthalmol. 2012; 153(1):111-9
- Haouchine B, Massin P, Tadayoni R, Erginay A, Gaudric A. Diagnosis of macular pseudoholes and lamellar macular holes by optical coherence tomography. Am J Ophthalmol. 2004 ;138(5):732–739
- Rishi P, Kothari AR. Lamellar macular hole: a new indication for vitrectomy with ILM peeling? Ret Cases & Brief Rep 2008; 2:272–273
- Kothari AR, Raman RP, Sharma T, Gupta M, Laxmi G. Is there a correlation between structural alterations and retinal sensitivity in morphological patterns of diabetic macular edema? Indian J Ophthalmol. 2013;61(5):230-2
- Witkin AJ, Ko TH, Fujimoto JG, et al. JS. Ultra-high resolution optical coherence tomography assessment of photoreceptors in retinitis pigmentosa and related diseases. Am J Ophthalmol. 2006; 142(6):945-52
- Cho SC, Woo SJ, Park KH, Hwang JM. Morphologic characteristics of the outer retina in cone dystrophy on spectral-domain optical coherence tomography. Korean J Ophthalmol. 2013; 27(1):19-27
- Hannan SR, de Salvo G, Stinghe A, Shawkat F, Lotery AJ. Common spectral domain OCT and electrophysiological findings in different pattern dystrophies. Br J Ophthalmol. 2013;97(5):605-10
- Goldberg NR, Greenberg JP, Laud K, Tsang S, Freund KB. Outer retinal tubulation in degenerative retinal disorders. Retina. 2013; 33(9):1871-6
- Yeoh J, Rahman W, Chen F, et al. Choroidal imaging in inherited retinal disease using the technique of enhanced depth imaging optical coherence tomography. Graefes Arch Clin Exp Ophthalmol. 2010; 248:1719–1728
- Dhoot DS, Huo S, Yuan A, et al. Evaluation of choroidal thickness in retinitis pigmentosa using enhanced depth imaging optical coherence tomography. Br J Ophthalmol. 2013; 97:66–69
- Duncker T, Greenberg JP, Ramachandran R, et al. Quantitative fundus autofluorescence and optical coherence tomography in best vitelliform macular dystrophy. Invest Ophthalmol Vis Sci. 2014;55(3):1471-82
- Kay DB, Land ME, Cooper RF, et al. Outer retinal structure in best vitelliform macular dystrophy. JAMA Ophthalmol. 2013; 131(9):1207-15
- Marmor MF. Comparison of screening procedures in hydroxychloroquine toxicity. Arch Ophthalmol. 2012; 130(4):461-9
- Chen E, Brown DM, Benz MS, et al. Spectral domain optical coherence tomography as an effective screening test for hydroxychloroquine retinopathy (the "flying saucer" sign). Clin Ophthalmol. 2010; 4:1151-8
- Kahn JB, Haberman ID, Reddy S. Spectral-domain optical coherence tomography as a screening technique for chloroquine and hydroxychloroquine retinal toxicity. Ophthalmic Surg Lasers Imaging. 201; 42(6):493-7
- Korah S, Kuriakose T. Optical coherence tomography in a patient with chloroquine-induced maculopathy. Indian J Ophthalmol. 2008; 56(6):511-3
- Kothari AR, Narendran V, Saravanan VR. In vivo sectional imaging of the retinal periphery using conventional optical coherence tomography systems. Indian J Ophthalmol. 2012; 60(3):235-9
- Brown DM, Regillo CD. Anti-VEGF agents in the treatment of neovascular age-related macular degeneration: applying clinical trial results to the treatment of everyday patients. Am J Ophthalmol 2007; 144: 627–37
- Coscas F, Coscas G, Souied E, Tick S, Soubrane G. Optical coherence tomography identification of occult choroidal neovascularization in age-related macular degeneration. Am J Ophthalmol 2007; 144: 592–9
- Krebs I, Brannath W, Glittenberg C, et al. Posterior vitreomacular adhesion: a potential risk factor for exudative age-related macular degeneration? Am J Ophthalmol. 2007; 144(5):741–746
- Krebs I, Glittenberg C, Zeiler F, Binder S. Spectral domain optical coherence tomography for higher precision in the evaluation of vitreoretinal adhesions in exudative age-related macular degeneration. Br J Ophthalmol. 2011; 95(10):1415–1418
- Fung AE, Lalwani GA, Rosenfeld PJ, et al. An optical coherence tomography-guided, variable dosing regimen with intravitreal ranibizumab (Lucentis) for neovascular age-related macular degeneration. Am J Ophthalmol. 2007;143(4):566-83
- Lalwani GA, Rosenfeld PJ, Fung AE, et al. A variable-dosing regimen with intravitreal ranibizumab for neovascular age-related macular degeneration: year 2 of the PrONTO Study. Am J Ophthalmol. 2009;148(1):43-58
- Brown DM, Regillo CD. Anti-VEGF agents in the treatment of neovascular age-related macular degeneration: applying clinical trial results to the treatment of everyday patients. Am J Ophthalmol 2007; 144: 627-37
- Lujan BJ, Rosenfeld PJ, Gregori G, et al. Spectral domain optical coherence tomographic imaging of geographic atrophy. Ophthalmic Surg Lasers Imaging. 2009 ;40(2):96-101
- Sakata LM, DeLeon-Ortega J, Sakata V, Girkin CA. Optical coherence tomography of the retina and optic nerve – a review. Clin Exp Ophthalmol 2009; 37: 90–99
- Bagga H, Feuer WJ, Greenfield DS. Detection of psychophysical and structural injury in eyes with glaucomatous optic neuropathy and normal standard automated perimetry. Arch Ophthalmol. 2006; 124(2):169-76
- Kim TW, Zangwill LM, Bowd C, et al. Retinal nerve fiber layer damage as assessed by optical coherence tomography in eyes with a visual field defect detected by frequency doubling technology perimetry but not by standard automated perimetry. Ophthalmology. 2007; 114(6):1053-7
- Sung KR, Na JH, Lee Y. Glaucoma diagnostic capabilities of optic nerve head parameters as determined by Cirrus HD optical coherence tomography. J Glaucoma2012;21:498–504
- Lisboa R, Paranhos A Jr., Weinreb RN, et al. Comparison of different spectral domain OCT scanning protocols for diagnosing preperimetric glaucoma. Invest Ophthalmol Vis Sci. 2013; 54:3417–25
- DeLeon-Ortega JE, Arthur SN, McGwin G Jr et al. Discrimination between glaucomatous and nonglaucomatous eyes using quantitative imaging devices and subjective optic nerve head assessment. Invest Ophthalmol Vis Sci 2006; 47: 3374–80
- Kanamori A, Nagai-Kusuhara A, Escano MF, et al. Comparison of confocal scanning laser ophthalmoscopy, scanning laser polarimetry and optical coherence tomography to discriminate ocular hypertension and glaucoma at an early stage. Graefes Arch Clin Exp Ophthalmol 2006; 244: 58–68
- Na JH, Sung KR, Lee JR, Lee KS, Baek S, Kim HK, Sohn YH. Detection of glaucomatous progression by spectral-domain optical coherence tomography. Ophthalmology. 2013;120(7):1388-95
- Na JH, Sung KR, Baek S, Lee JY, Kim S. Progression of retinal nerve fiber layer thinning in glaucoma assessed by cirrus optical coherence tomography-guided progression analysis. Curr Eye Res. 2013; 38(3):386-95
- Greenfield DS, Weinreb RN. Role of optic nerve imaging in glaucoma clinical practice and clinical trials. Am J Ophthalmol 2008; 145: 598–603
- Bussel II, Wollstein G, Schuman JS. OCT for glaucoma diagnosis, screening and detection of glaucoma progression. Br J Ophthalmol. 2014;98:ii15-ii19
- Kotowski J, Folio LS, Wollstein G, et al. Glaucoma discrimination of segmented cirrus spectral domain optical coherence tomography (SD-OCT) macular scans. Br J Ophthalmol. 2012; 96:1420–5
- Mwanza JC, Durbin MK, Budenz DL, et al. Glaucoma diagnostic accuracy of ganglion cell-inner plexiform layer thickness: comparison with nerve fiber layer and optic nerve head. Ophthalmology. 2012;119:1151–8
- Jeoung JW, Choi YJ, Park KH, et al. Macular ganglion cell imaging study: glaucoma diagnostic accuracy of spectral-domain optical coherence tomography. Invest Ophthalmol Vis Sci. 2013; 54:4422–9
- Takayama K, Hangai M, Durbin M, et al. A novel method to detect local ganglion cell loss in early glaucoma using spectral-domain optical coherence tomography. Invest Ophthalmol Vis Sci. 2012; 53:6904–13
- Nouri-Mahdavi K, Nowroozizadeh S, Nassiri N, et al. Macular ganglion cell/inner plexiform layer measurements by spectral domain optical coherence tomography for detection of early glaucoma and comparison to retinal nerve fiber layer measurements. Am J Ophthalmol. 2013; 156(6):1297-1307
- Hwang YH, Jeong YC, Kim HK, Sohn YH. Macular ganglion cell analysis for early detection of glaucoma. Ophthalmology. 2014; 121(8):1508-15
- Begum VU, Addepalli UK, Yadav RK,et al. Ganglion cell-inner plexiform layer thickness of high definition optical coherence tomography in perimetric and preperimetric glaucoma. Invest Ophthalmol Vis Sci. 2014;55(8):4768-75