


Introduction
Recent advances in ophthalmic imaging have opened new avenues for a more thorough and extensive understanding of various retinal diseases. Quite a few of these pathologies are attributed directly or indirectly to vascular abnormalities. This renders the need to develop technology capable of providing intricate data of the ocular vasculature.
Amongst these is Optical Coherence Tomography Angiography or OCTA. It is a novel, non-invasive imaging modality which provides rapid visualization of the retinal and choroidal microcirculation. Being a dyeless procedure, it eliminates the potential side effects of conventional angiography - i.e Fundus Fluorescein Angiography (FFA)(1) and Indocyanine Green Angiography (ICGA) (2), which require an intravenous injection of a contrast agent.
OCTA is a dyeless procedure
OCTA derives both functional as well as structural details of the vasculature by detecting the intrinsic motion of the red blood cells within the vessels.(3) By detecting minor changes in circulation, OCTA has revolutionized the imaging of certain pathologies such as choroidal neovascularization, polyps, and telangiectasia. It can unravel subtle retinal microvascular abnormalities in diabetic patients, eyes with occlusive vascular disorders, retinal and optic disc perfusion of glaucoma patients, and other neuro-ophthalmic disorders. In this article, we aim to discuss OCT angiography, its current clinical applications, limitations as well as future prospects.
OCTA generates an angiographic picture by analyzing the motion of RBCs between successive OCT B-scans (assesses decorrelation of signals of successive scans)
Working Principle
OCTA generates an angiographic picture of retinal and choroidal vasculature by detecting changes in the OCT reflectance signals generated by the motion of RBCs.
To detect these variations and derive quantitative data of the circulation, there was a need to capture repeated scans at the same location at a very high speed. This was not possible with earlier OCT models. As Fourier-Domain OCT was introduced, the rate of capturing scans increased up to 50 folds. The aforementioned property established the ease of imaging not only of the structure but also blood flow and thus opened new horizons for non-invasive angiography.
In contrast to the static tissue, flowing RBCs cause more variation in the OCT signal upon repeated scanning. OCTA compares the differences in these backscattered OCT signal intensity or amplitude (decorrelation signals) between successive OCT b-scans captured at the identical cross-section at very high speed to map the retinal and choroidal circulation.
The Split spectrum amplitude-decorrelation angiography (SS-ADA) is a technology first introduced in 2012 by Jia, et al.(4) It divides the OCT spectrum into narrower bands and the average of intensity decorrelation detected in each band is computed, thus constructing en-face angiograms of thick tissue slabs.
The vasculature of the scanned tissue can be represented as a 3D dataset. The structural image needs to be segmented accurately for optimal evaluation of retinal and choroidal vasculature. The segmentation boundaries conventionally used include an internal limiting membrane (ILM), outer boundaries of nerve fiber layer (NFL), inner plexiform layer, inner nuclear layer (INL), outer plexiform layer (OPL) respectively, the retinal pigmented epithelium (RPE), and Bruch's membrane (BM).
The 3D data thus derived is represented as 2D images. The data between defined segments constituting different layers of the tissue can be compressed into a single 2D en-face image. This way, the vasculature of defined layers can be studied individually and compared with each other. This flow data is often overlaid on the structural OCT image of the same cross-section, thus detailing the depth of vascular abnormalities such as retinal or choroidal neovascularization (CNV).
Objective evaluation of vascular abnormalities is also made possible by the quantification of OCTA. Vessel density, flow index, perfusion density, and vessel length are few of the indices derived from the en face angiograms.(5–9)
OCT-A Algorithms
In OCTA, repeated B-scans are performed through the area of interest and evaluated for change in specific parameters. Stationary tissues show minimal to no change in these signals, but dynamic tissues like flowing blood exhibit change over time that can be identified and used to generate a map of retinal vasculature. (10)According to the specific parameters a method uses, OCTA techniques can be classified into roughly three categories. All three types use the same data processing procedures but rely on different variables of the OCT signal. (11-12)
- Phase variance: These algorithms rely on the change in phase of reflected light that occurs between successive OCT B-scans. Small magnitudes of phase change are noted when light is reflected from dynamic tissues, these magnitudes are relatively larger when light is reflected off moving tissues like blood.
- Speckle variance (amplitude or intensity-based): Varying degrees of speckles occur with OCT, based on interference and reflections of light within the tissues. The changes in these speckles are compared in consecutive B-scans at identical pixel locations. The amount of similarity (correlation) or dissimilarity (decorrelation) between these pixels is calculated. In static tissue, there is a minimum change in speckles in successive scans (low decorrelation and high correlation). In dynamic tissues, like blood cells in vessels, significant changes in speckle occur (low correlation and high decorrelation). Flow maps are generated by plotting areas with low correlation as these areas correspond to blood vessels, this technique is known as ‘Correlation Mapping’. Similarly, areas with high decorrelation are plotted in a method known as ‘Amplitude Decorrelation’. (13)
- Complex variance (both phase and amplitude-based): These are hybrid algorithms that combine both phase variance and speckle variance. Optical Microangiography (OMAG) is based on complex variance. (14-15)
Application of averaging measures (SSADA, OCTARA) to these algorithms helps to improve the resolution and visualization of vasculature.(16)
- In Split Spectrum Amplitude Decorrelation Angiography (SSADA), OCT spectrum is split into several narrower bands. Inter-B-scan decorrelation is computed using the spectral bands separately and then averaged. SSADA improves the signal-to-noise ratio of flow detection at the cost of axial resolution. (17) Angiovue (Optovue Inc., Fremont, CA) is based on SSADA.
- Topcon’s proprietary motion contrast measure employs a ratio method, named OCTARA (OCTA Ratio Analysis), in which the full spectrum is kept intact and therefore the axial resolution is preserved. (18)SS OCT-A (DRI Triton OCT, Topcon, Japan) employs OCTARA.(19)
- AngioPlex (Carl Zeiss Meditec. Inc., USA) is based on OMAG.
OCTA algorithms include SSADA, OCTARA and OMAG which are derived from Phase variance, Speckle variance and complex variance
Comparison of OCTA with conventional angiography:
|
Conventional angiography |
OCTA |
|
|
Contrast agent |
Invasive procedure; requires a contrast dye |
Non-invasive; no contrast agent needed |
|
Time taken |
Image processed over a period of 10-30 minutes |
Angiograms obtained within 5-6 seconds |
|
Leakage |
Patterns of dye leakage, staining and poolong can be identified |
Cannot identify leaking vessels |
|
Field of view |
Up to 200 degrees |
Maximum-12x12mm |
|
Location of lesion |
Difficult to isolate the exact layer of the lesion |
Can identify the depth of lesion and delineate its boundaries |
|
En-face images with segmentation |
Only 1 composite image |
Multiple en face images segmented at various levels can be obtained |
|
Systemic adverse effects |
Present (e.g.Nausea, vomiting, anaphylaxis) |
Not present |
|
Contra-indication |
Known allergy to contrast agent, renal disease, liver dysfunction, pregnancy |
No contraindications |
TABLE 1: Comparison between fluorescein angiography and OCTA
Performing an OCTA
Three-dimensional images are acquired at high very speed and multiple en face images are created. These enface images can be scanned from the internal limiting membrane to as deep as the choroidoscleral junction, and the vascular plexus at different levels can be examined simultaneously. A recent study has described enface images of the posterior vitreous along with the characteristics of premacular bursa, Cloquet’s canal, and prevascular fissures (21).
Each 3-D scan set is acquired over approximately six seconds. Patient cooperation is imperative while obtaining scans to achieve better image quality. Different machines have different algorithms to measure image quality. For example, the signal strength index (SSI) provided by the RTVue system is used to define scan quality in the AngioVue OCTA device. Higher SSI values improved the repeatability of OCTA parameters and should be considered for image comparisons during followups to avoid misinterpretation of data. (22) Newer machines also have software to compensate for the patient’s involuntary eye movements and help acquire better angiograms with minimum artifacts.
Segmentation of the retinal B-scan image can be done at different levels. It is usually preset by the manufacturer or by the physician at 4 different levels – The superficial vascular layer, the deep vascular layer, the outer retina, and the choriocapillaries (Figure 1). (23) When a retinal scan is performed, the machine automatically detects the four segmentation layers as it scans from the internal limiting membrane. However, the segmentation lines can also be manually moved on the OCT B-scan by the physician to scan the area of interest. OCT B-scans are simultaneously recorded with OCT angiograms. This helps the physician to localize the pathology precisely on the B-scan and the corresponding angiogram.
Segmentation is usually done at four levels – Superficial capillary plexus, deep capillary plexus, Outer retina, and choriocapillaris
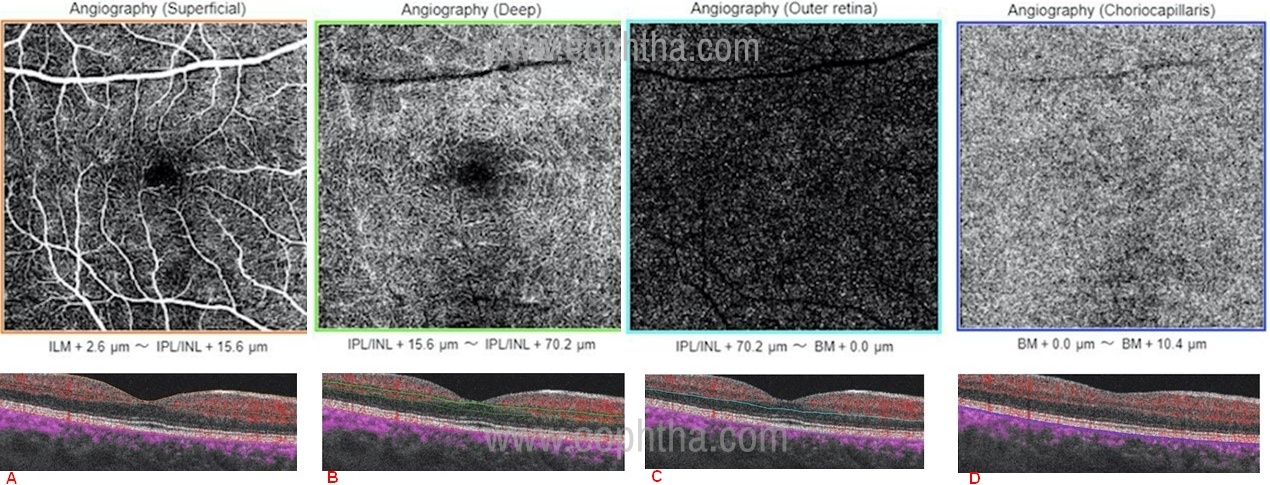
Figure 1: OCTA images segmented at different levels of the retina; a) superficial capillary plexus (the area between orange lines on OCT angiography-B scan ), b) deep capillary plexus (the area between green lines on OCT angiography-B scan ), c) outer retina (the area between light blue lines on OCT angiography-B scan ) and d) choriocapillaris (the area between dark blue lines on OCT angiography-B scan ).
Most software allows the option of taking scans of different sizes ranging from 3x3mm, 4.5x4.5mm and 12x12mm. (24) Smaller angiogram scans have better resolution and can pick up minute pathologies that cannot be picked up on a larger scan. 12x12mm scans can be used to pick up extrafoveal pathologies. With the advent of newer software, multiple angiograms can be taken and a montage image can be made to produce widefield angiogram images.
Signal strength, Segmentation columns, and size of the scan are important parameters while performing an OCTA
Artefacts
To date, numerous OCTA algorithms have been reported to provide improved imaging performance in contrasting functional blood vessels, through tackling one or more of following issues: imaging contrast, noise level, motion artifact, hyper-reflection feature, projection (or tailing) artifact and flow sensitivity.(25)
1. Motion artefact: Motion produced by means other than blood flow may also be detected by the machine and lead to image artefacts. Patient movements, pulsations related to the cardiac cycle, breathing, tremors, and microsaccades during the acquisition of OCTA scans create motion artefacts seen as dark or bright lines (white line artefact) on OCTA images.(26) Effects of eye movement can be minimised using eye-tracking software.
2. Stretch Artefact: Parts of image may appear to be stretched due to software correction of eye motion.
3. Displacement artifact: Eye motion during the scan may lead to final image composed of two images which are distant and discontinuous.
4. Random fluctuations of noise in low signal regions can create a false appearance of flow. Thresholding may be used to only process OCTA from structures which have a sufficiently strong signal, effectively deleting OCTA data from low signal or noisy structures.(27)However, thresholding may also inadvertently delete data from slow flow vasculature.
The same effect may be seen in fast flow areas. Current OCTA technologies only identify vascular flow within a limited dynamic range which may fail to identify blood vessels with flow rates at either extreme.(28) Any flow above or below this range may not be discernible. The sensitivity of OCTA to detect even minor alterations in blood flow can be increased by permitting the software to consider even minor changes in the decorrelation of the OCT signal as significant. This will enable the detection of subtle changes in vascular flow, however, it would also increase noise. The commercially available machines use a preset range, i.e. they have defined cut-offs of the level of decorrelation which needs to be detected.
5. Masking artefacts: Dense cataracts, vitreous opacities, pigment epithelial detachment, pre-retinal, intra-retinal or sub-retinal fluid, lipids, blood or even scar tissue can cause loss of signals obscuring visualization of retinal/choroidal vessels. The inability to detect decorrelation would be interpreted by the software as lack of flow and would appear as a dark area in the image. This can be minimised by simultaneously assessing the fundus and enface OCT image.
6. Patient blinking may cause dark bands in images called Blink artefacts.
7. Unmasking artefact: Increased OCT reflectivity associated with increased visibility of the vessels in OCTA in the regions of focal retinal pigment epithelium or retinal atrophy. (29)
8. Projection artifacts: Superficial vessels are seen in en face images of layers below the vessels. This occurs as the retinal pigment epithelium (RPE) is a strong reflector of the OCT signal. As the OCT light falls on the superficial vasculature, part of it gets reflected and part of it is transmitted and subsequently reflected from the highly reflective RPE. The decorrelation of superficial vasculature is thus detected from both its own reflection as well as the reflected signal from the RPE. This is a common artefact and must be understood by the user for proper interpretation of images. Adjusting the segmentation limits around the RPE can reduce or increase this artefact. Subtraction software can also help in removing the projections of vessels in deeper zones.
9. Segmentation artefacts: In retinal edema, atrophy, bleeding, high myopia (staphyloma) alterations in retinal thickness can cause the failure of automated segmentation strategies that are developed for healthy eyes. Such effects can be minimized by manual segmentation and correlation of en face OCT-A images with cross-sectional B-scan images.
10. Fringe washout artefact: In contrast to retinal blood flow, which generates high decorrelation signal in the superficial and middle retinal layers, blood flow within the small and large choroidal vessels generates the poor backscattered signal. It is only possible to visualize the vessel outline in the choroid because of the contrast between the decorrelation signal void within the lumen of choroidal vessels and the high signal in the surrounding stroma. 6
Artefacts in OCTA include Motion artefact, stretch artefact, displacement artefact, masking artefact, Blink artefact, Projection artefact, Segmentation artefact, and fringe washout artefact.
Interpretation of OCTA
OCTA provides flow information at a fixed point in time. It sends multiple A-scans in a second which is able to perceive minimum changes in the position of red blood cells in the blood vessel. This allows us to image the vascular network at different levels of the retina. Areas of swift movement of red blood cells are considered hyperflow areas (white) and are brighter than areas of slow movement which are considered hypoflow. If the movement of RBCs is very slow, like in microaneurysms, they can be missed on OCTA as they are considered as no-flow areas (black). (1)
For the Optovue Avanti software
- Superficial capillary plexus - 3 µm below the internal limiting membrane (ILM) to 15 µm below the inner plexiform layer (IPL).
- Deep capillary plexus - 15 µm below the IPL to 70 µm below the IPL.
- Outer retinal layer – up to 30 µm below the retinal pigment epithelium (RPE).
- Choriocapillaris - 30 µm to 60 µm below the RPE.
However, this can be different between different machines and can also be preset by the physician. Segmentation errors usually occur in the presence of any retinal pathology. Manual segmentation can be done to localize the area of interest. To accurately interpret an OCTA image, the physician should be familiar with normal anatomy on OCTA. (Figure 1)
OCTA provides a static representation of blood flow, unlike the fluorescein angiography which provides a dynamic image. OCTA comes along with a representative OCT B-scan image on which boundary lines of segmentation can be manually moved to look for pathologies. Flow signal overlay on the B-scan also confirms the level of flow on the OCTA image. The plane of the vascular pathology is best interpreted by analysing the en face flow scan and the OCT-B flow scan image together.
For Retinal vascular disease like diabetic retinopathy and vascular occlusions, the superficial and deep vascular plexus should be focused upon, whereas for choroidal neovascularization, the deep retina and choricocapillaris scans should be evaluated. 3x3mm scan provides the most detailed view of CNV along with the structure of the CNV complex, whereas larger scans are required for a wider view in retinal vascular diseases.
Clinical applications
1. Age-Related Macular Degeneration
Neovascular AMD (nAMD) is one of the leading causes of secondary CNV. Patients require multiple anti-VEGF injections with long and frequent follow-up. With its ability to image CNV non-invasively, OCT-A may be considered a powerful tool in the armamentarium of the retinal physician. As compared to the current gold standard of FFA, OCT-A shows good sensitivity (>75%) and high specificity (100%). (31) Large PEDs and hemorrhages preclude visualization of underlying vasculature, thus impeding diagnosis.
Type 1 CNV in more common in nAMD. On OCT-angiography the neovascular membrane of AMD is typically seen as a central feeder vessel with multiple radiating and branching vessels with ill-defined borders. The feeder vessel may be at the center of the branching network (medusa-head pattern) or it may be on one side of the network (sea-fan pattern). (32) In contrast, the less prevalent type 2 CNV is seen as a well-defined vascular network (Figure 2). (33) Blood flow to choriocapillaris is hypothesized to be compromised in eyes with nAMD, this may be detected using OCT-A. (34) OCT-A may find application in evaluating the natural history of geographic atrophy where reduced choriocapillaris flow beyond the borders of geographic atrophy suggests a primary vascular pathology.(35)
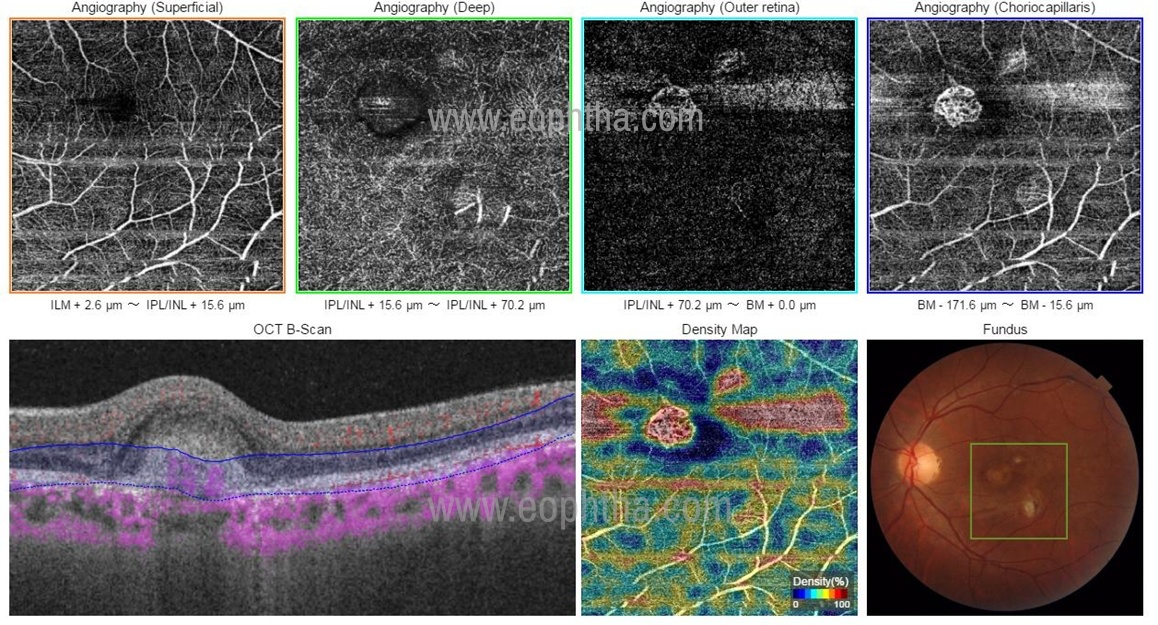
Figure 2: OCTA image compact type 2 CNV network. Note the dark blue lines have segmented the retina at the deep retinal level. That is why this is a type 2 membrane (subretinal). If you carefully see the machine by default is showing the membrane in the box mentioned as choriocapillaris. But this membrane is not at the choroidal level because the dark blue lines corresponding to the segmentation at this level are placed at the deep retinal level. Thus, you must be sure of the correct segmentation on the OCTA – B scan to prevent wrong interpretation.
A disadvantage of OCT-A in these cases is the difficulty in differentiating active neovascularization from mature or quiescent neovascular networks due to its inability to detect leaks. Several studies have attempted to identify OCT-A based biomarkers that may differentiate active from quiescent lesions – such as an increased rate of small vessel branching, peripheral arcades, and increased fractal dimension in the former.(36,37) This shortcoming can also be overcome by combining OCT-A with other modalities like OCT for the detection of intra-retinal or sub-retinal fluid and fundus imaging to detect fresh bleed.
OCT-A may be used to assess the treatment response to anti-VEGF therapy where reductions are seen in the CNV area, the total length of all vessels, the overall number of vascular segments, and fractal dimension (a parameter that reflects the complexity of the vascular structure of CNV).(37,38) These are automated parameters generated by the OCT-A analysis software. It has been observed that anti-VEGF treatment does not lead to complete regression of vascular network, rather it causes vascular remodeling with the development of mature non-leaky vessels. (39) Whether these mature networks require continued treatment is yet to be determined.
2. Secondary CNV
OCT-A has found application in the diagnosis of CNV due to other causes such as myopia, CSC, Adult-onset vitelliform disorder, and Best disease. OCT-A has a high detection rate for myopia associated CNV (compared with FFA), reported being over 90%.(40,41) Myopic CNVs appeared as irregular in shape, with poorly defined margins, and without a visible core. (42) OCT-A based morphological features may serve as markers of disease activity. It has a special role in pathological myopia where it helps to differentiate lacquer crack bleeds from CNV related hemorrhage as the bleed may obscure the CNV on FFA. In the case of Best disease, abnormalities of the foveal avascular zone in superficial, as well as deep layers, are seen on OCT-A, these may be associated with vascular abnormalities of the choriocapillaris. OCT-A has been reported to have high sensitivity (80-100%) in diagnosing BEST disease-related CNV.(43,44) Furthermore, OCT-A is superior to FFA in diagnosing CNV in such cases, as the vitelliform material masks the neovascularization on FFA. Similar observations of FAZ abnormalities, vascular rarefaction in the retinal capillary plexuses as well as choriocapillaris have also been made in patients of adult-onset foveomacular vitelliform dystrophy.(45) OCT-A has poor sensitivity in diagnosing dilated choroidal vessels in patients of CSC (when compared with the gold standard of FFA/ICGA).(46) This is partly contributed by the masking effect of SRF which impedes image capture of the underlying choroid. However, on the other hand, OCT-A shows high sensitivity in diagnosing CSC related CNV.(47) Irregular PEDs in eyes with CNV may harbor CNV that can be diagnosed with high sensitivity using OCT-A.(48) OCT-A can replace FFA in the diagnosis of idiopathic CNV.(49) However, caution must be exercised in eyes with large PEDs due to their masking effect on underlying CNV.
3.Pachychoroid spectrum:
The pachychoroid disease spectrum comprises four different clinical entities; pachychoroid pigment epitheliopathy (PPE), central serous chorioretinopathy (CSCR), pachychoroid neovasculopathy (PNV), and polypoidal choroidal vasculopathy (PCV).(50)ICGA is currently the gold standard investigation for the management of pachychoroid diseases, especially PCV.(51) However, OCT-angiography being a non-invasive modality has been extensively studied as a potential tool to diagnose, characterize, and follow up these cases. Several studies have found the OCT-angiograms to be far sensitive, specific and superior in detecting choroidal neovascularization in patients with pachychoroid diseases, compared to conventional dye angiography.(52–55) Detection of neovascularization in the pachychoroid spectrum is essential. Lack of timely intervention can lead to exudation, hemorrhage, and fibrotic scarring leading to irreversible visual disability. OCTA is also comparable to ICGA for detection of the branched vascular network (BVN) but the rate of polyp detection is variable from 17 to 85%.(56–59) Additionally, the polyp area has also been observed to be consistently smaller on OCTA when compared to ICGA.(60)Cheung et al demonstrated that in response to anti-VEGF therapy as well as combined photodynamic therapy, most eyes showed a reduction in flow within the PCV complex. However, it has now been shown by several studies that even after clinical improvement in exudation, absence of fluid or within a fibrosed scar, the flow signal often persists on OCT-angiogram.(59,61) Cheung et al postulated that the presence of these flow signals in the vascular network, in spite of inactive lesions may be a risk factor for recurrence.(59)
4.Diabetic retinopathy
Diabetic Retinopathy is microangiopathy and the leading cause of progressive visual loss in patients with Diabetes Mellitus. Early detection of microvascular changes and prompt management is essential to prevent visual disability in these patients. In recent times, OCTA has established itself to be a useful tool to assess the risk of progression as well as the management of diabetic retinopathy. The identification of structural changes of the microvasculature such as an enlarged foveal avascular zone (FAZ), capillary non-perfusion areas, microaneurysms, Intraretinal microvascular abnormalities (IRMAs) and retinal neovascularization is attainable by OCTA scans (Figure 3).(62)The details of FAZ are often obscured on FFA because of the surrounding leakage. OCTA overcomes this drawback and obtains detailed characteristics of the size and shape of FAZ as well as the adjacent vascular remodeling.New vessels may appear as minute punctate hyperfluorescent spots on FFA, rendering them indistinguishable from microaneurysms. OCTA is able to differentiate between the two as flow signal above the ILM is required to pick up neovascularization.(62) It can detect microaneurysms (MA) as well, however, not too reliably.(63) MA appear as focally dilated andabnormally shaped capillaries and their location can be identified in superficial and deep vascular plexuses.(64) Even though they have no value in the prediction of risk of disease progression, identification of MA determines the requirement of focal laser treatment for diabetic macular edema.(65)OCTA also has an added advantage of detecting abnormalities which are not well appreciated on FA such as retinal nonperfusion areas, reduced capillary density and increased vascular tortuosity. It can also detect IRMAs as dilated or looping vessels near the areas of capillary loss. Other features on OCTA which signify IRMAs include presence of intraretinal hyperreflective dots and outpouching of the ILM. They appear as focal areas of increased intraretinal blood flow within the superficial capillary plexus on en-face angiograms.(66)Even though FA is the current gold standard in the management of diabetic retinopathy, OCTA is fast emerging as a sustainable alternative to do so owing to its rapid, non-invasive nature and its ability to pick up subtle microvascular changes which may not be initially spotted on FA.
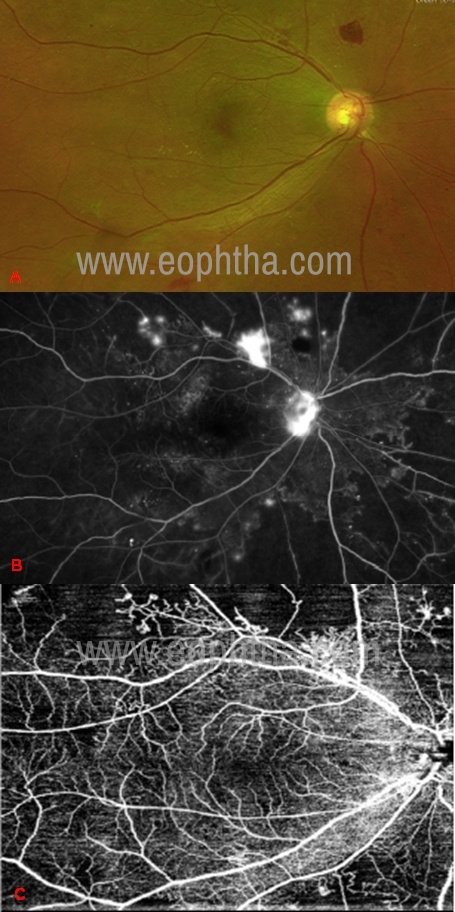
Figure 3: A case of PDR in which the NVD, NVE, and the capillary nonperfusion areas can be clearly identified on FFA and the 12x12mm OCTA image. A) fundus image, b) FFA image, c) OCTA image
5. Retinal Vascular Occlusions:
Of late, OCTA has been utilized to confirm the clinical diagnosis as well as to gather in-depth details of the retinal layers in cases of Retinal Vascular Occlusions (RVO). In retinal venous occlusive diseases, OCTA has been proven to adequately identify areas of capillary non-perfusion and the morphology of the foveal avascular zone (FAZ).(67,68) The FAZ area and vessel density on OCTA have been observed to strongly correlate with visual acuity in RVO prior to and post anti-VEGF injections.
Moussa et al studied the efficacy of SS-OCTA in grading macular perfusion in eyes with retinal venous occlusions and found it to be a more efficient grader of ischemic damage than FFA.(69) Additionally, the aforementioned microvascular abnormalities, collateral vessels, capillary telangiectasia, microaneurysms and areas of vascular congestion can be isolated in different levels of the retinal capillary plexus by OCTA.(70)In Retinal Artery occlusions, it is a sensitive tool to demonstrate the extent of ischemia and to further to monitor vascular flow changes during the course of the disease. OCTA can also pick up fine microvascular changes and detect early neovascularization.(71)However, its inability to scan the peripheral retina with high resolution is a barrier for its utility in eyes with retinal vascular occlusions since these pathologies majorly affect the peripheral retinal vasculature.
6. Uveitis
OCTA is emerging as a valuable tool for diagnosis and studying the course of the disease in uveitis, mainly posterior uveitis and white dot syndromes. Anterior segment OCTA can detect iris hyperemia and subtle iris neovascularization, however, it is limited by the pupil diameter, iris pigmentation, and optical distortion due to refraction of light at the cornea. OCTA provides better scans in darker and deep pigmented iris. (72) OCTA studies in intermediate uveitis showed reduced vascular density in superficial and deep vascular plexus of the retina and the choriocapillaris, irrespective of the presence of macular edema or capillary non-perfusion areas. (73) There may be difficulty in acquiring good quality angiograms due to the presence of vitritis or vitreous hemorrhage in cases of intermediate, posterior uveitis, and vasculitis. OCTA can reveal subtle microvascular flow loss areas that are not detected by routine ophthalmoscopy or fluorescein angiography. In Behcet’s retinal vasculitis, the deep capillary plexus is more affected than the superficial plexus and also shows microvascular changes like preifoveal capillary telangiectasia. (74) The foveal avascular zone can be clearly assessed due to the absence of leakage seen in fluorescein angiography. Hence, the risk of early visual loss can be detected with the use of OCTA.
OCTA has been widely used in the study of white do syndromes and its complications. Acute posterior multifocal placoid pigment epitheliopathy (APMPPE) and serpiginous choroiditis showed perfusion defects at the level of choriocapillaris and choroid during the early stage of the disease (Figure 4). These perfusion deficits resolved over the course of the disease. This suggests that choriocapillaris is the primary focus of the disease. (75) In contrary to this, the choriocapillaris is normal in multiple evanescent white dot syndrome (MEWDS) which suggests that the primary injury is at the photoreceptors and outer retina. (76) OCTA also helps in picking up inflammatory CNV in cases of punctate inner choroidopathy, multifocal choroiditis, and other white dot syndromes which can be inconclusive on FA. (77)
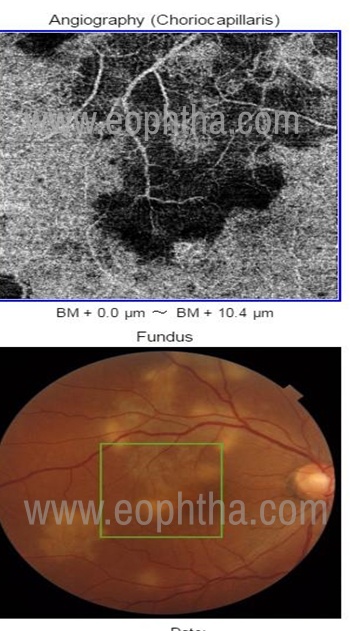
Figure 4: Serpiginous choroiditis showing flow voids (hypoflow) in the choriocapillaris suggesting the involvement of choriocapillaris in Serpigionous choroiditis
7. Macular telangiectasia
Macular telangiectasia type 2 is an acquired idiopathic retinal disorder characterized by dilation and ectasia of perifoveal capillaries which may be complicated by neovascularization. OCT-A shows reduced capillary density in both superficial and deep layers in the foveal zone. (78)Enlargement of FAZ can also be seen.(79)The reduced capillary densities have been shown to worsen over time. (80) These changes correspond with the foveal thinning and worsening visual acuity that is classically seen in MacTel. Similar changes are seen unilaterally in patients with Macular Telangiectasia type 1.(81,82) Perifoveal staining is seen on FFA in eyes with MacTel. This finding complicates the diagnosis of CNV because it becomes difficult to identify superimposed leaks. OCT-A is very helpful in this scenario for the diagnosis as well as follow up as the neovascular membrane can be clearly identified. (83) Because of this unique advantage of OCT-A in these cases, it is suitable for replacing FFA. (84) It may very well be the only diagnostic modality needed to diagnose and monitor MacTel Type 2 at every stage. (85)
8. Hereditary retinal disorders
The role of OCT-A in vitelliform retinal dystrophies has been described earlier. Microvascular density in both superficial and deep retinal capillary plexus is reduced in retinitis pigmentosa. (86) This reduced vascularity has been correlated with a reduced cone density on adaptive optics imaging. (87) No significant change is seen in choriocapillaris vessel density, however, this finding is still controversial. (88) In Stargardt Disease there is vascular rarefaction in the choriocapillaris layer that corresponds to decreased retinal sensitivity on microperimetry. (89)Increased disease severity is associated with decreased vascular density and vascular tortuosity of retinal vasculature on OCT-A. Patients of choroideremia exhibit a significant impairment of vessel density in the choriocapillaris, outer retina as well as inner retina. (90)The FAZ area is also reduced. However, these changes are not seen in female carriers. (91) X-linked retinoschisis shows perifoveal microvascular alterations similar to telangiectasia. (92)
9. Glaucoma:
Various studies that have attempted to investigate the alterations in ocular circulation in glaucomatous eyes, reveal a reduction in blood flow in the retinal, peripapillary choroid, and retrobulbar circulation. (93-98)
In recent times, OCTA has emerged as a useful tool to diagnose and evaluate the progression of glaucoma. Jia et al first demonstrated a significant decrease in Vessel Density (VD) and flow indices within the optic nerve head and peripapillary retina in both pre-perimetric and perimetric primary angle glaucoma (POAG)(6,8), multiple investigators have subsequently confirmed these findings. Studies that followed have been consistent to show a significant decrease in VD in eyes with Primary Angle Closure Glaucoma(99,100) and in Pseudoexfoliation Glaucoma(101)as well.
The extent of VD and flow index decline seem to correlate with the degree of functional loss inglaucomatous eyes. These parameters have also been determined to moderately to highly correlate with Visual field parameters.(8,102,103) OCTA is also advantageous to differentiate between healthy subjects, patients with ocular hypertension, glaucoma suspects, and patients with POAG.(104,105)
However, it remains elusive whether OCTA is superior to the current standard assessment to detect glaucoma. Furthermore, it is still uncertain whether the compromised microcirculation is a factor that leads to glaucomatous damage or does it result from low metabolic consumption of the impaired tissue. More research is warranted in this field.
10. Neuro-ophthalmology:
In recent times, we have been able to utilize OCT angiograms for the evaluation of optic nerve head circulation in a variety of neuro-ophthalmologic disorders.
Regardless of its origin, optic disc edema is found to be associated with vessel tortuosity and dilated prelaminar capillary network on OCTA, especially localized in the thickened retinal nerve fiber layer. However, this may not fully correspond to the extent of vascular dropout that may depend on the true nature of the optic nerve condition and its severity.(106) In eyes with pseudo-edema of optic disc secondary to Leber’s Hereditary Optic Neuropathy(LHON), telangiectatic vessels with focal tortuosity is a feature described on OCTA.(107) OCT angiograms are also beneficial to evaluate the peripapillary microvasculature of eyes with Non-arteritic anterior ischaemic optic neuropathy (NAION), in both acute stage as well as post-resolution of the optic disc edema.(108) However, their role in longitudinal follow up of these cases is still under question as the flow density reduction at different layers in NAION may not truly represent a primary ischaemic process, but rather may be the result of compressive edema, or of imaging artefacts.
Even though the intrinsic details of optic nerve head circulation are well captured by OCTA, this revolutionary imaging modality has yet to establish its role as a standard of practice for monitoring the progression of optic nerve pathologies.
Quantitative analysis
Quantitative analysis of OCTA is important to standardize interpretations of objective clinical outcomes. It is usually inbuilt as specific algorithms in the machine or can be done manually using software like Image. The greyscale image is binarised into black and white images using specific thresholds following which a ration of white and black is calculated and various parameters are deduced. Flow density is also an added inbuilt feature in the OCTA machine which helps us to amount of flow in specific layers of the retina (Figure 5). In the last few years, many quantitative features have been described which include blood vessel tortuosity (BVT), blood vessel density (BVD), vessel branching coefficient, vessel branching angle, vessel perimeter index (VPI), vessel complexity index (VCI) blood vessel caliber (BVC), fovea avascular zone area (FAZ-A), fovea avascular zone contour irregularity (FAZ-CI), Branchpoint analysis (BPA), choroidal vascular analysis, branching width ratio, and differential artery–vein (A-V) analysis.
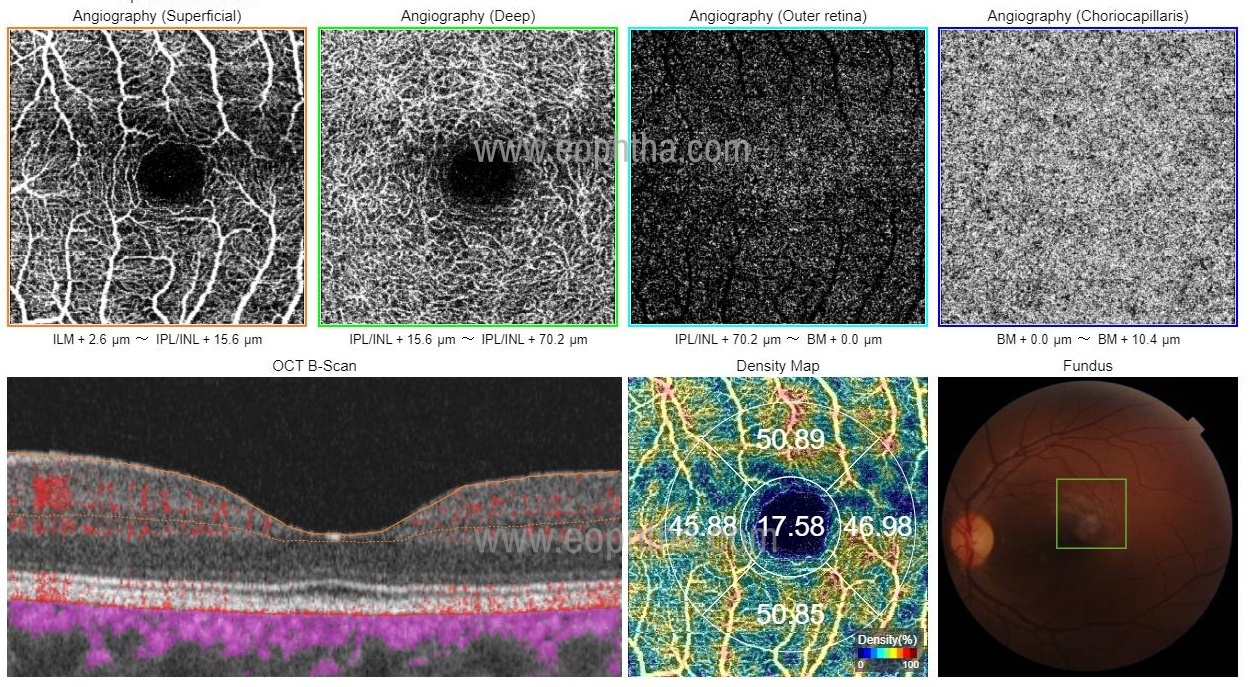
Figure 5: Quantitative analysis of flow density at the superficial capillary plexus. The vascular density values are mentioned in the density map as a percentage. These are generally calculated as a ratio of the white pixels (signify flow) to the total number of pixels.
BVD – Ratio of image area occupied by the blood vessels. This is important in vascular diseases that have areas of ischemia and vascular dropouts. (109)
BVC –It is used to measure the amount of vascular dilation or constriction in vascular disorders like DR and sickle cell retinopathy. It is the ratio of vessel area to the vessel length (109)
BVT – It is a degree of vessel distortion in conditions where there is turbulent blood flow to disturbances in the vessel wall (110)
VPI- It is the ratio between the total length of blood vessel boundaries and total blood vessel area in a segmented vessel map. VPI can detect vessel dropouts and early ischemia.(111)
FAZ-A- the area of the avascular zone can be manually segmented or is an inbuilt algorithm to detect the are in both the superficial and deep avascular zones. (109)
FAZ-CI – measures the structural irregularity of the FAZ. It is calculated as the ratio of the perimeter of FAZ-A to a reference circle of an ideal FAZ 2
VCI – It is used to quantify changes in the vascular complexity (112)
BPA – It helps to quantify changes in the vascular bifurcation (113)
Differential artery–vein (A-V) analysis – Compares changes in arteries relative to the veins. (114)
CNV analysis – used to assess morphological distortions like sea fan, medusa, tangled and dead tree in choroidal vasculature. CNV area is a commonly examined parameter. The most important step is the segmentation of CNV which is usually done manually.
Future directions
Significant research is being done towards enhancing the field of view of OCT-A. Research-oriented platforms like the PLEX Elite 9000 device (Carl Zeiss Meditec, Inc., Dublin, CA) offer an in-built montage module that can stitch together an OCT-A image covering an area equivalent to the 7-standard field (7SF) images. (115)
The use of Dense B-scan OCTA (DB OCTA) software extension offers structural OCT and OCTA images with less speckle and noise, respectively. Flow information is superimposed on high-resolution B-scans which allow the observer to resolve projection artefacts with relative ease. (116)
Deep learning algorithms are being tested to increase the accuracy of automated segmentation protocols, and have shown promising results so far. (117) Deep learning is also being tested for enhancing OCT-A image quality by denoising captured images.(118,119) In the future, artificial intelligence may completely bypass the need for specialized OCT-A algorithms by directly generating flow images from OCT B-scans.(120)
References
1. López-sáez Mp, Ordoqui E, Tornero P, Baeza A, Sainza T, Zubeldia Jm, Et Al. Fluorescein-induced Allergic Reaction. Ann Allergy Asthma Immunol. 1998 Nov;81(5):428–30. 2. Hope-ross M, Yannuzzi La, Gragoudas Es, Guyer Dr, Slakter Js, Sorenson Ja, Et Al. Adverse Reactions Due To Indocyanine Green. Ophthalmology. 1994 Mar;101(3):529–33. 3.De Carlo Te, Romano A, Waheed Nk, Duker Js. A Review Of Optical Coherence Tomography Angiography (Octa). Int J Retin Vitr. 2015 Apr;1(1):5. 4. Jia Y, Tan O, Tokayer J, Potsaid B, Wang Y, Liu Jj, Et Al. Split-spectrum Amplitude-decorrelation Angiography With Optical Coherence Tomography. Opt Express. 2012 Feb 13;20(4):4710. 5. Jia Y, Bailey St, Hwang Ts, Mcclintic Sm, Gao Ss, Pennesi Me, Et Al. Quantitative Optical Coherence Tomography Angiography Of Vascular Abnormalities In The Living Human Eye. Proc Natl Acad Sci Usa. 2015 May 5;112(18):E2395-2402. 6. Jia Y, Morrison Jc, Tokayer J, Tan O, Lombardi L, Baumann B, Et Al. Quantitative Oct Angiography Of Optic Nerve Head Blood Flow. Biomed Opt Express. 2012 Dec 1;3(12):3127–37. 7. Jia Y, Bailey St, Wilson Dj, Tan O, Klein Ml, Flaxel Cj, Et Al. Quantitative Optical Coherence Tomography Angiography Of Choroidal Neovascularization In Age-related Macular Degeneration. Ophthalmology. 2014 Jul;121(7):1435–44. 8. Jia Y, Wei E, Wang X, Zhang X, Morrison Jc, Parikh M, Et Al. Optical Coherence Tomography Angiography Of Optic Disc Perfusion In Glaucoma. Ophthalmology. 2014 Jul;121(7):1322–32. 9. Pechauer Ad, Jia Y, Liu L, Gao Ss, Jiang C, Huang D. Optical Coherence Tomography Angiography Of Peripapillary Retinal Blood Flow Response To Hyperoxia. Invest Ophthalmol Vis Sci. 2015 May;56(5):3287–91. 10. Ehlers Jp. The Oct Angiography Revolution: 5 Emerging Themes. Ophthalmol Retina. 2017;1(6):457-460. Doi:10.1016/J.Oret.2017.09.007 11. Xu J, Song S, Li Y, Wang R. Complex-based Oct Angiography Algorithm Recovers Microvascular Information Superior To Amplitude Or Phase-based Algorithm In Phase-stable Systems. Phys Med Biol. 2017;63(1):015023. 12. Zhang A, Zhang Q, Chen C-l, Wang Rk. Methods And Algorithms For Optical Coherence Tomography-based Angiography: A Review And Comparison. J Biomed Opt. 2015;20(10). 13. Chen C-l, Wang Rk. Optical Coherence Tomography Based Angiography [Invited]. Biomed Opt Express. 2017;8(2):1056-1082. 14.Reif R, Wang Rk. Optical Microangiography Based On Optical Coherence Tomography. In: Drexler W, Fujimoto Jg, Eds. Optical Coherence Tomography. Springer International Publishing; 2015:1373-1397. 15.Jia Y, Tan O, Tokayer J, Et Al. Split-spectrum Amplitude-decorrelation Angiography With Optical Coherence Tomography. Opt Express. 2012;20(4):4710-4725. 16. Gorczynska I, Migacz Jv, Zawadzki Rj, Capps Ag, Werner Js. Comparison Of Amplitude-decorrelation, Speckle-variance And Phase-variance Oct Angiography Methods For Imaging The Human Retina And Choroid. Biomed Opt Express. 2016;7(3):911-942. 17. Jia Y, Tan O, Tokayer J, Et Al. Split-spectrum Amplitude-decorrelation Angiography With Optical Coherence Tomography. Opt Express. 2012;20(4):4710-4725. 18. Stanga Pe, Tsamis E, Papayannis A, Stringa F, Cole T, Jalil A. Swept-source Optical Coherence Tomography Angiotm (Topcon Corp, Japan): Technology Review. In: Bandello F, Souied Eh, Querques G, Eds. Developments In Ophthalmology. Vol 56. S. Karger Ag; 2016:13-17. 19.Munk Mr, Giannakaki-zimmermann H, Berger L, Et Al. Oct-angiography: A Qualitative And Quantitative Comparison Of 4 Oct-a Devices. Plos One. 2017;12(5). 20. Kornblau Is, El-annan Jf. Adverse Reactions To Fluorescein Angiography: A Comprehensive Review Of The Literature. Surv Ophthalmol. 2019 Oct;64(5):679–93. 21.Oct En Face Analysis Of The Posterior Vitreous Reveals Topographic Relationships Among Premacular Bursa, Prevascular Fissures, And Cisterns. Leong, Belinda C.S. Et Al. Ophthalmology Retina , Volume 4, Issue 1, 84 – 89 22. Yu, Jeffrey J Et Al. Signal Strength Reduction Effects In Oct Angiography 23. De Carlo, T.E., Romano, A., Waheed, N.K.et Al; A Review Of Optical Coherence Tomography Angiography (Octa).int J Retin Vitr1,5 (2015). 24. Spaide Rf, Curcio Ca. Evaluation Of Segmentation Of The Superficial And Deep Vascular Layers Of The Retina By Optical Coherence Tomography Angiography Instruments In Normal Eyes. Jama Ophthalmol. 2017;135(3):259 25. Xu J, Song S, Li Y, Wang R. Complex-based Oct Angiography Algorithm Recovers Microvascular Information Superior To Amplitude Or Phase-based Algorithm In Phase-stable Systems. Phys Med Biol. 2017;63(1):015023. 26. Sambhav K, Grover S, Chalam Kv. The Application Of Optical Coherence Tomography Angiography In Retinal Diseases. Surv Ophthalmol. 2017;62(6):838-866. 27.Image Artifacts In Optical Coherence Angiography. Accessed May 10, 2020. Https://Www.Ncbi.Nlm.Nih.Gov/Pmc/Articles/Pmc4712934/ 28. Ghasemi Falavarjani K, Al-sheikh M, Akil H, Sadda Sr. Image Artefacts In Swept-source Optical Coherence Tomography Angiography. Br J Ophthalmol. 2017;101(5):564-568. Doi:10.1136/Bjophthalmol-2016-309104 29.Chen Fk, Viljoen Rd, Bukowska Dm. Classification Of Image Artefacts In Optical Coherence Tomography Angiography Of The Choroid In Macular Diseases: Oct Angiography In Macular Diseases. Clin Experiment Ophthalmol. 2016;44(5):388-399. 30.Caroline R Baumal, Retinal Physician, Volume: 15, Issue: Jan/Feb 2018, Page(S): 32, 34 31. Ahmed D, Stattin M, Graf A, Et Al. Detection Of Treatment-naive Choroidal Neovascularization In Age-related Macular Degeneration By Swept Source Optical Coherence Tomography Angiography. Retina Phila Pa. 2018;38(11):2143-2149. 32.Kuehlewein L, Bansal M, Lenis Tl, Et Al. Optical Coherence Tomography Angiography Of Type 1 Neovascularization In Age-related Macular Degeneration. Am J Ophthalmol. 2015;160(4):739-748.E2. 33. Farecki M-l, Gutfleisch M, Faatz H, Et Al. Characteristics Of Type 1 And 2 Cnv In Exudative Amd In Oct-angiography. Graefes Arch Clin Exp Ophthalmol Albrecht Von Graefes Arch Klin Exp Ophthalmol. 2017;255(5):913-921. 34.Cole Ed, Ferrara D, Novais Ea, Louzada Rn, Waheed Nk. Clinical Trial Endpoints For Optical Coherence Tomography Angiography In Neovascular Age-related Macular Degeneration: Retina. 2016;36:S83-s92. 35. Schneider Ew, Fowler Sc. Optical Coherence Tomography Angiography In The Management Of Age-related Macular Degeneration. Curr Opin Ophthalmol. 2018;29(3):217-225 36. Al-sheikh M, Iafe Na, Phasukkijwatana N, Sadda Sr, Sarraf D. Biomarkers Of Neovascular Activity In Age-related Macular Degeneration Using Optical Coherence Tomography Angiography. Retina Phila Pa. 2018;38(2):220-230. 37. Faatz H, Farecki M-l, Rothaus K, Et Al. Optical Coherence Tomography Angiography Of Types 1 And 2 Choroidal Neovascularization In Age-related Macular Degeneration During Anti-vegf Therapy: Evaluation Of A New Quantitative Method. Eye Lond Engl. 2019;33(9):1466-1471. 38. Faatz H, Farecki M-l, Rothaus K, Gutfleisch M, Pauleikhoff D, Lommatzsch A. Changes In The Oct Angiographic Appearance Of Type 1 And Type 2 Cnv In Exudative Amd During Anti-vegf Treatment. Bmj Open Ophthalmol. 2019;4(1):E000369. 39. Wirth Ma, Freiberg F, Pfau M, Wons J, Becker Md, Michels S. Optical Coherence Tomography Angiography In Age-related Macular Degeneration: Persistence Of Vascular Network In Quiescent Choroidal Neovascularization. Acta Ophthalmol (Copenh). 2017;95(4):428-430. 40. Miyata M, Ooto S, Hata M, Et Al. Detection Of Myopic Choroidal Neovascularization Using Optical Coherence Tomography Angiography. Am J Ophthalmol. 2016;165:108-114. Doi:10.1016/J.Ajo.2016.03.009 41. Bruyère E, Miere A, Cohen Sy, Et Al. Neovascularization Secondary To High Myopia Imaged By Optical Coherence Tomography Angiography. Retina Phila Pa. 2017;37(11):2095-2101. 42. Querques L, Giuffrè C, Corvi F, Et Al. Optical Coherence Tomography Angiography Of Myopic Choroidal Neovascularisation. Br J Ophthalmol. 2017;101(5):609-615. 43. Guduru A, Gupta A, Tyagi M, Jalali S, Chhablani J. Optical Coherence Tomography Angiography Characterisation Of Best Disease And Associated Choroidal Neovascularisation. Br J Ophthalmol. 2018;102(4):444-447. 44.Lupidi M, Coscas G, Cagini C, Coscas F. Optical Coherence Tomography Angiography Of A Choroidal Neovascularization In Adult Onset Foveomacular Vitelliform Dystrophy: Pearls And Pitfalls. Invest Ophthalmol Vis Sci. 2015;56(13):7638-7645. 45.Querques G, Zambrowski O, Corvi F, Et Al. Optical Coherence Tomography Angiography In Adult-onset Foveomacular Vitelliform Dystrophy. Br J Ophthalmol. 2016;100(12):1724-1730. 46.Min J-y, Lv Y, Yu S, Gong Y-y. Findings Of Oct-angiography Compared To Fluorescein And Indocyanine Green Angiography In Central Serous Chorioretinopathy: Oct-angiography Findings In Central Serous Chorioretinopathy. Lasers Surg Med. 2018;50(10):987-993. 47. Bonini Filho Ma, De Carlo Te, Ferrara D, Et Al. Association Of Choroidal Neovascularization And Central Serous Chorioretinopathy With Optical Coherence Tomography Angiography. Jama Ophthalmol. 2015;133(8):899-906. 48. De Carlo Te, Rosenblatt A, Goldstein M, Baumal Cr, Loewenstein A, Duker Js. Vascularization Of Irregular Retinal Pigment Epithelial Detachments In Chronic Central Serous Chorioretinopathy Evaluated With Oct Angiography. Ophthalmic Surg Lasers Imaging Retina. 2016;47(2):128-133. 49.Kumar A, Vohra R, Agrawal S, Et Al. Characterization Of Idiopathic Choroidal Neovascularization Using Fluorescein Angiography, Indocyanine Green Angiography, And Optical Coherence Tomography Angiography. Ophthalmic Surg Lasers Imaging Retina. 2018;49(7):516-522. 50. Gallego-pinazo R, Dolz-marco R, Gómez-ulla F, Mrejen S, Freund Kb. Pachychoroid Diseases Of The Macula. Med Hypothesis Discov Innov Ophthalmol. 2014;3(4):111–5. 51. Tan Cs, Ngo Wk, Lim Lw, Tan Nw, Lim Th, Everest Study Group. Everest Study Report 3: Diagnostic Challenges Of Polypoidal Choroidal Vasculopathy. Lessons Learnt From Screening Failures In The Everest Study. Graefes Arch Clin Exp Ophthalmol. 2016 Oct;254(10):1923–30. 52. Bonini Filho Ma, De Carlo Te, Ferrara D, Adhi M, Baumal Cr, Witkin Aj, Et Al. Association Of Choroidal Neovascularization And Central Serous Chorioretinopathy With Optical Coherence Tomography Angiography. Jama Ophthalmol. 2015 Aug;133(8):899–906. 53. Quaranta-el Maftouhi M, El Maftouhi A, Eandi Cm. Chronic Central Serous Chorioretinopathy Imaged By Optical Coherence Tomographic Angiography. Am J Ophthalmol. 2015 Sep;160(3):581-587.E1. 54. Demirel S, Yanık Ö, Nalcı H, Batıoğlu F, Özmert E. The Use Of Optical Coherence Tomography Angiography In Pachychoroid Spectrum Diseases: A Concurrent Comparison With Dye Angiography. Graefes Arch Clin Exp Ophthalmol. 2017 Dec;255(12):2317–24. 55. Dansingani Kk, Balaratnasingam C, Klufas Ma, Sarraf D, Freund Kb. Optical Coherence Tomography Angiography Of Shallow Irregular Pigment Epithelial Detachments In Pachychoroid Spectrum Disease. Am J Ophthalmol. 2015 Dec;160(6):1243-1254.E2. 56. Inoue M, Balaratnasingam C, Freund Kb. Optical Coherence Tomography Angiography Of Polypoidal Choroidal Vasculopathy And Polypoidal Choroidal Neovascularization. Retina (Philadelphia, Pa). 2015 Nov;35(11):2265–74. 57. Tomiyasu T, Nozaki M, Yoshida M, Ogura Y. Characteristics Of Polypoidal Choroidal Vasculopathy Evaluated By Optical Coherence Tomography Angiography. Invest Ophthalmol Vis Sci. 2016 01;57(9):Oct324-330. 58. Tanaka K, Mori R, Kawamura A, Nakashizuka H, Wakatsuki Y, Yuzawa M. Comparison Of Oct Angiography And Indocyanine Green Angiographic Findings With Subtypes Of Polypoidal Choroidal Vasculopathy. Br J Ophthalmol. 2017 Jan;101(1):51–5. 59. Cheung Cmg, Yanagi Y, Mohla A, Lee Sy, Mathur R, Chan Cm, Et Al. Characterization And Differentiation Of Polypoidal Choroidal Vasculopathy Using Swept Source Optical Coherence Tomography Angiography. Retina (Philadelphia, Pa). 2017 Aug;37(8):1464–74. 60. Takayama K, Ito Y, Kaneko H, Kataoka K, Sugita T, Maruko R, Et Al. Comparison Of Indocyanine Green Angiography And Optical Coherence Tomographic Angiography In Polypoidal Choroidal Vasculopathy. Eye (Lond). 2017 Jan;31(1):45–52. 61.Miere A, Semoun O, Cohen Sy, El Ameen A, Srour M, Jung C, Et Al. Optical Coherence Tomography Angiography Features Of Subretinal Fibrosis In Age-related Macular Degeneration. Retina (Philadelphia, Pa). 2015 Nov;35(11):2275–84. 62. Hwang Ts, Jia Y, Gao Ss, Bailey St, Lauer Ak, Flaxel Cj, Et Al. Optical Coherence Tomography Angiography Features Of Diabetic Retinopathy. Retina (Philadelphia, Pa). 2015 Nov;35(11):2371–6. 63.Schwartz Dm, Fingler J, Kim Dy, Zawadzki Rj, Morse Ls, Park Ss, Et Al. Phase-variance Optical Coherence Tomography: A Technique For Noninvasive Angiography. Ophthalmology. 2014 Jan;121(1):180–7. 64.Ishibazawa A, Nagaoka T, Takahashi A, Omae T, Tani T, Sogawa K, Et Al. Optical Coherence Tomography Angiography In Diabetic Retinopathy: A Prospective Pilot Study. American Journal Of Ophthalmology. 2015 Jul;160(1):35-44.E1. 65. Diabetic Retinopathy Clinical Research Network. A Randomized Trial Comparing Intravitreal Triamcinolone Acetonide And Focal/Grid Photocoagulation For Diabetic Macular Edema. Ophthalmology. 2008 Sep;115(9):1447–9, 1449.E1-10. 66. Schaal Kb, Munk Mr, Wyssmueller I, Berger Le, Zinkernagel Ms, Wolf S. Vascular Abnormalities In Diabetic Retinopathy Assessed With Swept-source Optical Coherence Tomography Angiography Widefield Imaging. Retina (Philadelphia, Pa). 2019 Jan;39(1):79–87. 67. Nobre Cardoso J, Keane Pa, Sim Da, Bradley P, Agrawal R, Addison Pk, Et Al. Systematic Evaluation Of Optical Coherence Tomography Angiography In Retinal Vein Occlusion. American Journal Of Ophthalmology. 2016 Mar;163:93-107.E6. 68. Kuehlewein L, An L, Durbin Mk, Sadda Sr. Imaging Areas Of Retinal Nonperfusion In Ischemic Branch Retinal Vein Occlusion With Swept-source Oct Microangiography. Ophthalmic Surg Lasers Imaging Retina. 2015 Feb;46(2):249–52. 69.Moussa M, Leila M, Bessa As, Lolah M, Abou Shousha M, El Hennawi Hm, Et Al. Grading Of Macular Perfusion In Retinal Vein Occlusion Using En-face Swept-source Optical Coherence Tomography Angiography: A Retrospective Observational Case Series. Bmc Ophthalmol. 2019 Dec;19(1):127. 70. Rispoli M, Savastano Mc, Lumbroso B. Capillary Network Anomalies In Branch Retinal Vein Occlusion On Optical Coherence Tomography Angiography. Retina (Philadelphia, Pa). 2015 Nov;35(11):2332–8. 71. Baumal Cr. Optical Coherence Tomography Angiography Of Retinal Artery Occlusion. In: Bandello F, Souied Eh, Querques G, Editors. Developments In Ophthalmology. S. Karger Ag; 2016 [Cited 2020 May 10]. P. 122–31. 72.Zett C Et Al (2018) Comparison Of Anterior Segment Optical Coherence Tomography Angiography And Fluorescein Angiography For Iris Vasculature Analysis. Graefes Arch Clin Exp Ophthalmol 256(4):683–691 73.Wintergerst Mwm Et Al (2018) Optical Coherence Tomography Angiography In Intermediate Uveitis. Am J Ophthalmol 194:35–45 74. Somkijrungroj T Et Al (2017) Assessment Of Vascular Change Using Swept-source Optical Coherence Tomography Angiography: A New Theory Explains Central Visual Loss In Behcet’s Disease. J Ophthalmol 2017:2180723 75.Mangeon M, Zett C, Amaral C, Novais E, Muccioli C, Andrade G, Et Al. Multimodal Evaluation Of Patients With Acute Posterior Multifocal Placoid Pigment Epitheliopathy And Serpiginous Choroiditis. Ocular Immunology And Inflammation. 2018;26(8):1212–18. 76.Pereira F, Lima Lh, De Azevedo Agb, Zett C, Farah Me, Belfort R, Jr. Swept-source Oct In Patients With Multiple Evanescent White Dot Syndrome. J Ophthalmic Inflamm Infect. 2018;8(1):16 77.Levison Al, Baynes Km, Lowder Cy, Kaiser Pk, Srivastava Sk. Choroidal Neovascularisation On Optical Coherence Tomography Angiography In Punctate Inner Choroidopathy And Multifocal Choroiditis. Br J Ophthalmol. 2017;101(5):616–22. 78. Toto L, Di Antonio L, Mastropasqua R, Et Al. Multimodal Imaging Of Macular Telangiectasia Type 2: Focus On Vascular Changes Using Optical Coherence Tomography Angiography. Invest Ophthalmol Vis Sci. 2016;57(9):Oct268-276. 79. Park Yg, Park Y-h. Quantitative Analysis Of Retinal Microvascular Changes In Macular Telangiectasia Type 2 Using Optical Coherence Tomography Angiography. Plos One. 2020;15(4):E0232255. 80. Demir St, Güven D, Karatas Me, Dirim Ab, Sendül Sy, Ustaoglu M. Evaluation Of 1-year Follow-up Results Of Macular Telangiectasia Type 2 Cases By Optical Coherence Tomography Angiography. Gms Ophthalmol Cases. 2019;9:Doc29. 81. Pappuru Rr, Peguda Hk, Dave Vp. Optical Coherence Tomographic Angiography In Type 1 Idiopathic Macular Telangiectasia. Clin Exp Optom. 2018;101(1):143-144. 82. Mao L, Weng S-s, Gong Y-y, Yu S-q. Optical Coherence Tomography Angiography Of Macular Telangiectasia Type 1: Comparison With Mild Diabetic Macular Edema. Lasers Surg Med. 2017;49(3):225-232. 83. Estawro Rg, Embabi Sn. Optical Coherence Tomography Angiography In Monitoring Proliferative Macular Telangiectasia Type 2 Treatment Response. Ophthalmic Surg Lasers Imaging Retina. 2019;50(8):485-491. 84. Zhang Q, Wang Rk, Chen C-l, Et Al. Swept Source Optical Coherence Tomography Angiography Of Neovascular Macular Telangiectasia Type 2. Retina Phila Pa. 2015;35(11):2285-2299. 85. Roisman L, Rosenfeld Pj. Optical Coherence Tomography Angiography Of Macular Telangiectasia Type 2. Dev Ophthalmol. 2016;56:146-158. 86. Wang X-n, Zhao Q, Li D-j, Et Al. Quantitative Evaluation Of Primary Retinitis Pigmentosa Patients Using Colour Doppler Flow Imaging And Optical Coherence Tomography Angiography. Acta Ophthalmol (Copenh). 2019;97(7):E993-e997. 87. Lin R, Shen M, Pan D, Et Al. Relationship Between Cone Loss And Microvasculature Change In Retinitis Pigmentosa. Invest Ophthalmol Vis Sci. 2019;60(14):4520-4531. 88. Ling L, Gao F, Zhang Q, Et Al. Optical Coherence Tomography Angiography Assessed Retinal And Choroidal Microvasculature Features In Patients With Retinitis Pigmentosa: A Meta-analysis. Biomed Res Int. 2019;2019:6723917. 89. Mastropasqua R, Senatore A, Di Antonio L, Et Al. Correlation Between Choriocapillaris Density And Retinal Sensitivity In Stargardt Disease. J Clin Med. 2019;8(9). 90. Murro V, Mucciolo Dp, Giorgio D, Et Al. Optical Coherence Tomography Angiography (Oct-a) In Young Choroideremia (Chm) Patients. Ophthalmic Genet. 2019;40(3):201-206. 91. Abbouda A, Dubis Am, Webster Ar, Moosajee M. Identifying Characteristic Features Of The Retinal And Choroidal Vasculature In Choroideremia Using Optical Coherence Tomography Angiography. Eye Lond Engl. 2018;32(3):563-571. 92. Stanga Pe, Papayannis A, Tsamis E, Et Al. Swept-source Optical Coherence Tomography Angiography Of Paediatric Macular Diseases. In: Bandello F, Souied Eh, Querques G, Eds. Developments In Ophthalmology. Vol 56. S. Karger Ag; 2016:166-173. 93. Arend O, Plange N, Sponsel We, Remky A. Pathogenetic Aspects Of The Glaucomatous Optic Neuropathy: Fluorescein Angiographic Findings In Patients With Primary Open Angle Glaucoma. Brain Res Bull. 2004 Feb 15;62(6):517–24. 94. François J, De Laey Jj. Fluorescein Angiography Of The Glaucomatous Disc. Ophthalmologica. 1974;168(4):288–98. 95. Talusan E, Schwartz B. Specificity Of Fluorescein Angiographic Defects Of The Optic Disc In Glaucoma. Arch Ophthalmol. 1977 Dec;95(12):2166–75. 96. Kornzweig Al, Eliasoph I, Feldstein M. Selective Atrophy Of The Radial Peripapillary Capillaries In Chronic Glaucoma. Arch Ophthalmol. 1968 Dec;80(6):696–702. 97. Hayreh Ss. Blood Supply Of The Optic Nerve Head And Its Role In Optic Atrophy, Glaucoma, And Oedema Of The Optic Disc. Br J Ophthalmol. 1969 Nov;53(11):721–48. 98. Tobe La, Harris A, Hussain Rm, Eckert G, Huck A, Park J, Et Al. The Role Of Retrobulbar And Retinal Circulation On Optic Nerve Head And Retinal Nerve Fibre Layer Structure In Patients With Open-angle Glaucoma Over An 18-month Period. Br J Ophthalmol. 2015 May;99(5):609–12. 99. Rao Hl, Pradhan Zs, Weinreb Rn, Riyazuddin M, Dasari S, Venugopal Jp, Et Al. Vessel Density And Structural Measurements Of Optical Coherence Tomography In Primary Angle Closure And Primary Angle Closure Glaucoma. Am J Ophthalmol. 2017 May;177:106–15. 100. Zhang S, Wu C, Liu L, Jia Y, Zhang Y, Zhang Y, Et Al. Optical Coherence Tomography Angiography Of The Peripapillary Retina In Primary Angle-closure Glaucoma. Am J Ophthalmol. 2017 Oct;182:194–200. 101. Suwan Y, Geyman Ls, Fard Ma, Tantraworasin A, Chui Ty, Rosen Rb, Et Al. Peripapillary Perfused Capillary Density In Exfoliation Syndrome And Exfoliation Glaucoma Versus Poag And Healthy Controls: An Octa Study. Asia Pac J Ophthalmol (Phila). 2018 Apr;7(2):84–9. 102.Liu L, Jia Y, Takusagawa Hl, Pechauer Ad, Edmunds B, Lombardi L, Et Al. Optical Coherence Tomography Angiography Of The Peripapillary Retina In Glaucoma. Jama Ophthalmol. 2015 Sep;133(9):1045–52. 103.Yarmohammadi A, Zangwill Lm, Diniz-filho A, Suh Mh, Yousefi S, Saunders Lj, Et Al. Relationship Between Optical Coherence Tomography Angiography Vessel Density And Severity Of Visual Field Loss In Glaucoma. Ophthalmology. 2016;123(12):2498–508. 104. Yarmohammadi A, Zangwill Lm, Diniz-filho A, Suh Mh, Manalastas Pi, Fatehee N, Et Al. Optical Coherence Tomography Angiography Vessel Density In Healthy, Glaucoma Suspect, And Glaucoma Eyes. Invest Ophthalmol Vis Sci. 2016 01;57(9):Oct451-459. 105.Chen C-l, Zhang A, Bojikian Kd, Wen Jc, Zhang Q, Xin C, Et Al. Peripapillary Retinal Nerve Fiber Layer Vascular Microcirculation In Glaucoma Using Optical Coherence Tomography-based Microangiography. Invest Ophthalmol Vis Sci. 2016 01;57(9):Oct475-485. 106. Tan Acs, Tan Gs, Denniston Ak, Keane Pa, Ang M, Milea D, Et Al. An Overview Of The Clinical Applications Of Optical Coherence Tomography Angiography. Eye. 2018 Feb;32(2):262–86. 107. Barboni P, Carbonelli M, Savini G, Ramos C Do Vf, Carta A, Berezovsky A, Et Al. Natural History Of Leber’s Hereditary Optic Neuropathy: Longitudinal Analysis Of The Retinal Nerve Fiber Layer By Optical Coherence Tomography. Ophthalmology. 2010 Mar;117(3):623–7. 108. Sharma S, Ang M, Najjar Rp, Sng C, Cheung Cy, Rukmini Av, Et Al. Optical Coherence Tomography Angiography In Acute Non-arteritic Anterior Ischaemic Optic Neuropathy. Br J Ophthalmol. 2017;101(8):1045–51. 109. Alam, M, Thapa, D, Lim, Ji, Cao, D, Yao, X.computer-aided Classification Of Sickle Cell Retinopathy Using Quantitative Features In Optical Coherence Tomography Angiography. Biomed Opt Express2017; 8:4206–16 110.Alam, M, Thapa, D, Lim, Ji, Cao, D, Yao, X.quantitative Characteristics Of Sickle Cell Retinopathy In Optical Coherence Tomography Angiography. Biomed Opt Express2017; 8:1741–53 111.Ye, H, Zheng, C, Lan, X, Zhao, L, Qiao, T, Li, X, Zhang, Y.evaluation Of Retinal Vasculature Before And After Treatment Of Children With Obstructive Sleep Apnea-hypopnea Syndrome By Optical Coherence Tomography Angiography. Graefes Arch Clin Exp Ophthalmol2019; 257:543–48 112. Zahid, S, Dolz-marco, R, Freund, Kb, Balaratnasingam, C, Dansingani, K, Gilani, F, Mehta, N, Young, E, Klifto, Mr, Chae, B, Yannuzzi, La, Young, Ja.fractal Dimensional Analysis Of Optical Coherence Tomography Angiography In Eyes With Diabetic Retinopathy. Invest Ophthalmol Vis Sci2016; 57:4940–47 113.Le, D, Alam, M, Miao, Ba, Lim, Ji, Yao, X.fully Automated Geometric Feature Analysis In Optical Coherence Tomography Angiography For Objective Classification Of Diabetic Retinopathy. Biomed Opt Express2019; 10:2493–503 114. Son, T, Alam, M, Kim, T-h, Liu, C, Toslak, D, Yao, X.near Infrared Oximetry-guided Artery–vein Classification In Optical Coherence Tomography Angiography. Exp Biol Med2019; 244:813–818 115. Kadomoto S, Uji A, Muraoka Y, Akagi T, Miyata M, Tsujikawa A. A Novel Strategy For Quantification Of Panoramic En Face Optical Coherence Tomography Angiography Scan Field. Graefes Arch Clin Exp Ophthalmol. 2019;257(6):1199-1206. 116. Freund Kb, Gattoussi S, Leong Bcs. Dense B-scan Optical Coherence Tomography Angiography. Am J Ophthalmol. 2018;190:78-88. 117. Guo M, Zhao M, Cheong Amy, Dai H, Lam Akc, Zhou Y. Automatic Quantification Of Superficial Foveal Avascular Zone In Optical Coherence Tomography Angiography Implemented With Deep Learning. Vis Comput Ind Biomed Art. 2019;2(1):21. 118. Kadomoto S, Uji A, Muraoka Y, Akagi T, Tsujikawa A. Enhanced Visualization Of Retinal Microvasculature In Optical Coherence Tomography Angiography Imaging Via Deep Learning. J Clin Med. 2020;9(5). 119. Sawai Y, Miyata M, Uji A, Et Al. Usefulness Of Denoising Process To Depict Myopic Choroidal Neovascularisation Using A Single Optical Coherence Tomography Angiography Image. Sci Rep. 2020;10(1):6172. 120. Lee Cs, Tyring Aj, Wu Y, Et Al. Generating Retinal Flow Maps From Structural Optical Coherence Tomography With Artificial Intelligence. Sci Rep. 2019;9(1):5694.