


Visual electrophysiology is an extremely useful tool to study the retinal function objectively. It assesses the functional aspects of not only the retina but also the visual pathway as a whole. Even in this era of advanced imaging, one cannot ignore the importance of the functional aspects of the cellular network in the retina. The commonly used tests with their salient applications are enumerated in Table 1.
|
S.no |
Test |
Application |
|
1. |
Electroretinogram(ERG) |
Elicits mass response from the Retina |
|
2. |
Electro-oculogram(EOG) |
Assesses the function of the Retinal pigment epithelium |
|
3. |
Pattern ERG(PERG) |
Differentiates macular and optic nerve pathology |
|
4. |
Multifocal ERG(MfERG) |
Picks up focal retinal pathology and maps out the topography |
|
5. |
Photopic Negative Response(PhNR) |
Tests the function of retinal ganglion cells |
|
6. |
Visual Evoked Potentials(VEP) |
Assesses the visual pathway up to the occipital cortex |
|
7. |
Multifocal VEP(MfVEP) |
Picks up focal dysfunction of the visual pathway and maps the topography |
Table 1. Enumerates the common electrophysiological tests done in the clinic and their main applications
Standard Full-Field Electroretinogram
The Electroretinogram is a mass electrical potential generated by all the retinal cells in response to full-field stimulation by light. This is the most commonly used test in a retina clinic.
History
Dewar was the first to record electrical potentials from an intact animal eye using electrodes in 1877.1 Kahn and Lowenstein first published human ERG.2
Recording Protocol
Stimulus:
Full-field ERG must be recorded with a uniform, diffuse, even, white background illumination of 17-34 cd/m2 which is best achieved by an integrated sphere or dome, the “Ganzfeld”. This illumination is provided by light-emitting diodes placed within the surface of the Ganzfeld. Flash stimuli of duration less than 5 ms and of the specified wavelength and intensity are then given to record the ERG as per the International Society of Clinical Electrophysiology and Vision (ISCEV) Guidelines as mentioned in Figure 1.
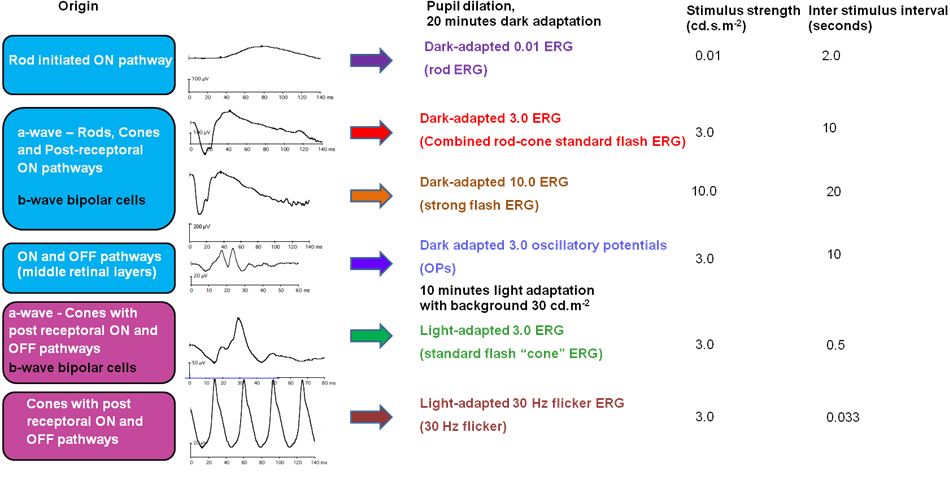
Figure 1: Depicts the 6 waveforms recorded as per the ISCEV protocol along with the stimulus intensities used to elicit these responses
The electrical response of the retina thus obtained is processed by passing through band filters of 0.3-300 Hz (except for oscillatory potentials which have band filters between 75 Hz and 300 Hz) and amplifiers to amplify the true response and increase the signal to noise ratio (SNR).
Electrodes:
- Active electrode
- Reference electrode
- Ground electrode
The active electrode can be a contact lens or a non-contact lens electrode:
Contact Lens electrodes
1. Burian Allen (BA) electrode: Is a bipolar reusable electrode (Figure 2) that provides a stable configuration, highest amplitude recordings, and is not significantly affected by eye movements. Contact lens acts as an active electrode and the lid speculum acts as a reference electrode. These are expensive and needs care on insertion to avoid any corneal abrasions.
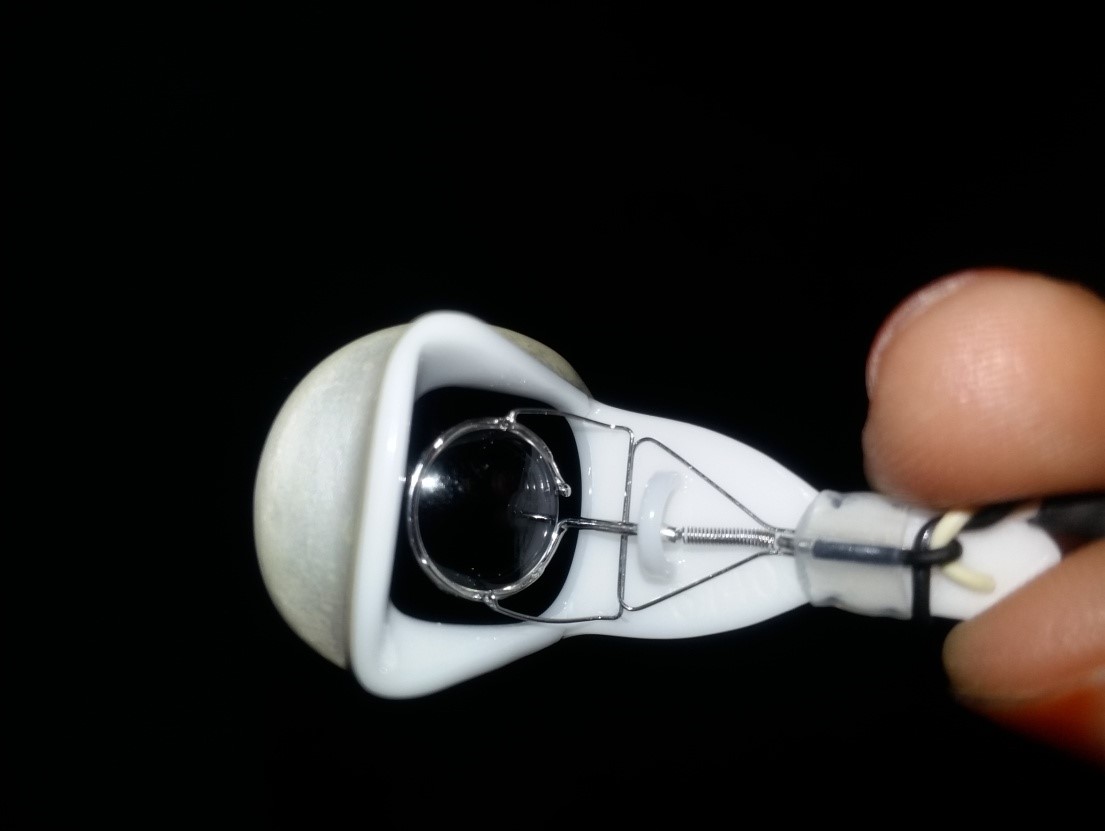
Figure 2: Burian Allen electrode
2. Jet electrode: This isa unipolar, disposable electrode (Figure 3). The contact lens with gold plated plastic material at the circumference acts as the active electrode. A separate Gold cup skin electrode is needed as a reference.
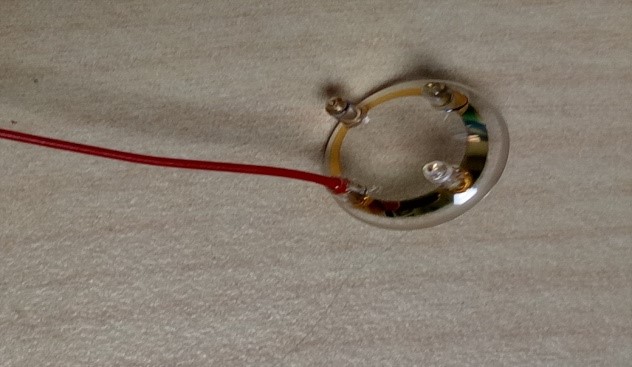
Figure 3: Jet electrode
While using the contact lens electrodes, the cornea needs to be protected using a non-viscous, non-irritating, and non-allergenic conductive ionic solution.
Non-contact lens electrodes
These electrodes are in contact with the bulbar conjunctiva.
1. Dawson Trick Litzkow (DTL) electrode: It is a unipolar disposable fiber electrode (Figure 4). The fiber lies in the inferior fornix as close to the inferior limbus as possible. These are especially used where stimulus image clarity is important (PERG recording) and in the case of corneal infections or bleb. The amplitudes of the responses measured with this electrode are less than those recorded with the BA electrode. Gold cup skin electrodes are used as reference electrodes.
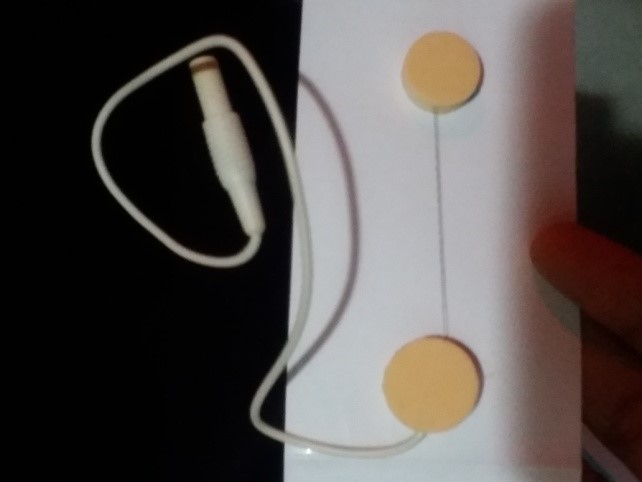
Figure 4: Dawson Trick Litzkow (DTL) electrode
2. HKL loop and gold foil are other non-contact lens electrodes used.
Reference Electrode is placed at the outer canthus for unipolar electrodes.
Gold cup electrodes are used as Ground electrodes (Figure 5) placed at the ear lobe or forehead. To establish a good electrode contact and keep the impedance less than 5kW a conductive paste or a gel has to be applied on the skin that is adequately cleaned and scrubbed.
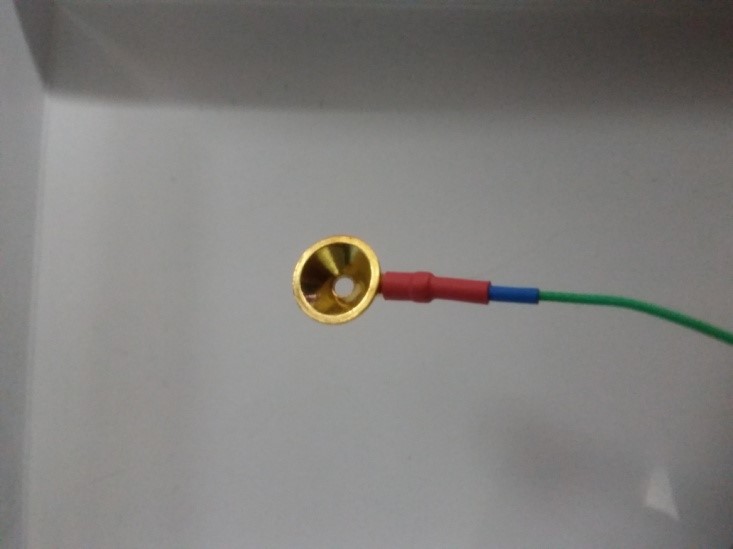
Figure 5: Gold cup electrode
Patient preparation:
ERG is recorded with maximum pupillary dilation for stimulating the entire retina. With a dark adaptation for 20 minutes, scotopic responses are recorded in dim illumination. Photopic responses are recorded after light adaptation for 10 minutes according to the ISCEV protocol. If tests using bright illumination like the fluorescein angiography and fundus photography have been done on the same day prior to ERG prolonged dark adaptation may be necessary.
Origin of ERG waveforms3
In dark, the photoreceptors are in a depolarized (decreased negativity) state with membrane potential of roughly -40 mV. More concentration of cyclic Guanosine monophosphate (GMP) inside the cell in dark opens the Na+ and Ca2+ channels resulting in decreased negativity When light strikes the photoreceptor outer segments, photopigment rhodopsin get activated, which activates G-protein, transducin. This causes activation of enzyme cyclic GMP phosphodiesterase, ultimately causes a reduction in cyclic GMP levels in the outer segment of photoreceptors. The reduction in intracellular cyclic GMP causes the sodium channel to close, thereby result in hyperpolarization (increased negativity inside the cell) with membrane potential of roughly -70 mV, which generates a negative a-wave in electroretinogram.
The light-induced hyperpolarization of the photoreceptor decreases the release of neurotransmitters at their synaptic terminals, which causes depolarization of ON-bipolar cells. With depolarization of ON-bipolar cells, there is an increase in extracellular potassium in the post receptoral outer plexiform layer leading to depolarization of Muller cells. Hence bipolar cells and Muller cells contribute to the generation of b-wave. A typical waveform is shown in Figure 6.
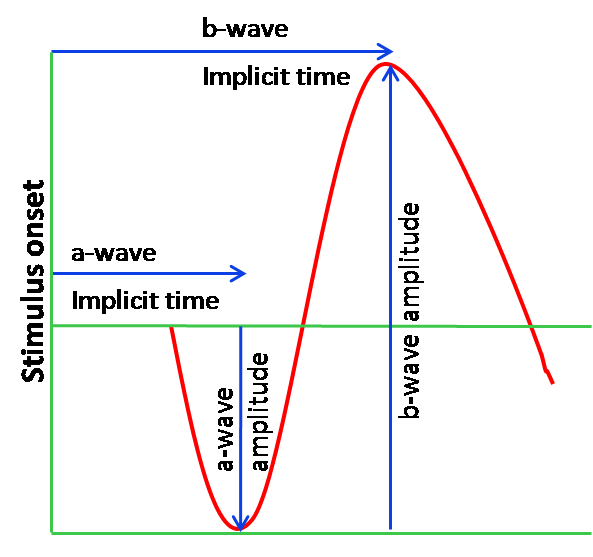
Figure 6: Typical Waveform with the a-wave, b-wave and the nomenclature used for interpretation. The a-wave amplitude is measured from the baseline to the a-wave trough and the b-wave amplitude is measured from the a-wave trough to the peak of the b-wave. The implicit time or the time to peak of the a-wave and b-wave is measured from the onset of the stimulus to the trough of a wave or the peak of b-wave respectively.
ERG reporting and analysis:
The amplitudes and implicit times are measured for each waveform as shown in Figure 6. The ISCEV recommends 6 basic waveform recordings, 4 done under the scotopic conditions, and 2 under photopic conditions as shown in Figure 1.
This is done so as to distinguish the
a) the rod function from the cones;
b) to distinguish between a photoreceptor disorder and the bipolar cell disorder
c) to evaluate the amacrine cells as represented by the Oscillatory potentials.
The interpretation of each waveform is given below.
1. The dark-adapted 0.01 response:
Recorded under scotopic conditions, this response represents the sensitivity of the rod system to respond to a low illumination flash. At low intensities, the rod response is selectively elicited because the rods are almost 1000 times more sensitive than cones. The stimulus strength used however is too low to obtain sufficient phototransduction to produce a recordable a-wave, but a-wave and b-wave is recorded due to the amplification of transmission from the photoreceptors to the inner retina
2. The dark-adapted 3.0 response
This standard flash (3.0 cd.s.m2) scotopic response gives a mixed or combined response from the “rods as well as the cones system”. The a-wave is sharp and negative, arising from both the rods and cones while the b-wave is of a much larger amplitude contributed by the rod ON bipolar cells and the cone ON and OFF bipolar cells.
3. The dark-adapted 10.0 response
This is the scotopic response to a brighter flash (10 photopic cd.s/m2). The a-wave is better defined and more representative of the photoreceptor function. This ERG may be particularly reliable in cases with opaque media and immature retina.4
4. The dark-adapted 3.0 oscillatory response
Oscillatory potentials are recorded in dark-adapted eyes using the 3.0 cd.s/m2 flash stimulus; OPs originate in the amacrine cells. These actually appear as high-frequency waveforms on the ascending limb of the b wave in the 3.0 dark-adapted response. They are derived from this response by filtering all frequencies below 75 Hz using high pass filters and represented as a separate waveform.
5. The light-adapted 3.0 response
This photopic response is obtained in response to the standard flash after 10 minutes of light adaptation using the background Ganzfeld illumination. It is characterized by a sharper, a-wave with a smaller amplitude and a shorter implicit time compared to that obtained during scotopic conditions. The photopic 3.0 ERG is primarily from the cone system with the a-wave receiving contributions from the cone photoreceptors and from the off bipolar cells and the b-wave coming from post-receptor activity of the ON and OFF bipolar cells.5
6. The light-adapted 30 Hz flicker response
This response is obtained from the light-adapted eye using a full field standard flash of 3.0 cd.s/m2 with flashes presented at the rate of 30 stimuli per second. Rods do not respond at this range, so this response is selectively cone driven. For analysis of the waveforms, it is best to discard the first few waveforms.
Physiological factors affecting ERG
Stimulus Related
1. Intensity of Stimulus
The amplitudes of dark-adapted and light-adapted a-wave and b-waves increase with an increase in intensities and saturates beyond a level. Figure 7 shows the non-recordable waveform and reduced amplitudes with lower intensities which increase with increasing intensities.
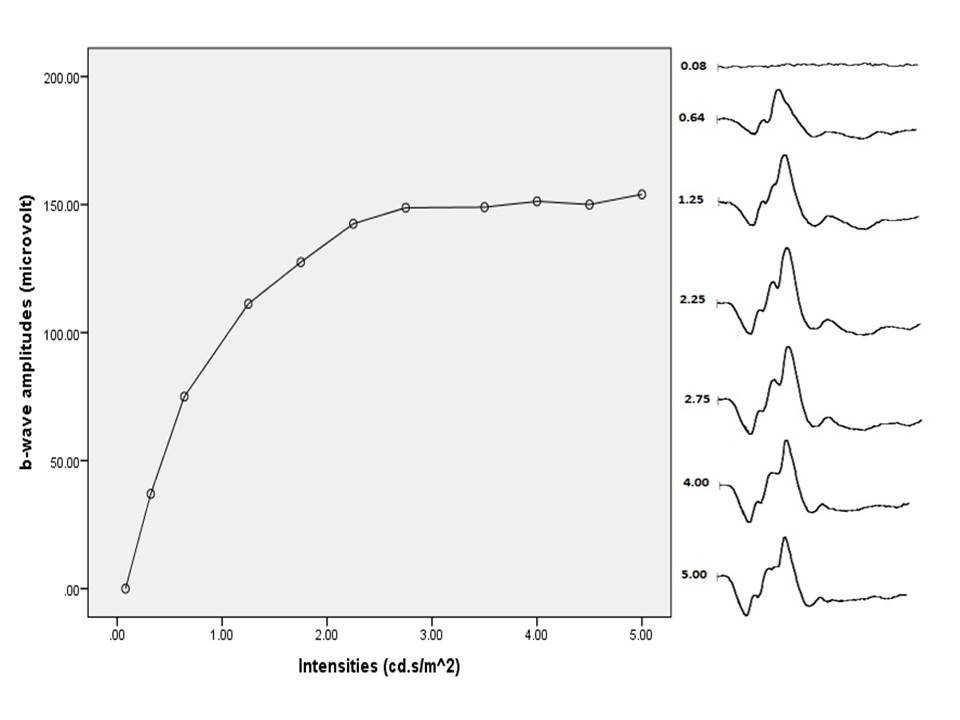
Figure 7: Light-adapted bright flash shows an increase in amplitude with an increase in intensity and saturates beyond 3.0 cd.s/m2
2. Wavelength or color of the stimulus
Blue light selectively stimulates the rod response while orange or red stimulus can record responses more representative of the cone activity
3. Frequency of Stimulus
Where cones can respond with separate responses for up to 70 Hz, rods do not show separate responses at higher frequencies.
4. Duration of stimulus
Long duration flashes can increase the amplitude as well as the duration of the response.
Subject Related
1. Age and Sex
Newborn babies have very low ERG amplitudes that increase rapidly to almost young adult levels by 6 months to 1 year of life. A decrease in ERG amplitudes and an increase in implicit times is seen with aging.6 This has been attributed to a decrease in media clarity, a decrease in photopigment, lipofuscin accumulation, and bipolar and Muller cell death in the aging retina.7 No significant differences have been seen in normal ERGs between males and females.8
2. Refractive error
The decrease in ERG amplitudes is seen with an increase in axial length especially in high myopes (>6 diopters). Delay in implicit times with increasing axial length is also seen though less remarkable.9
3. Interocular difference
Interocular difference in normal eyes, for the b wave, has been seen to be about 8-11 %.10
4. Diurnal changes
Diurnal changes in amplitude of the b-wave are known. This is related to the cycle of outer segment disc shedding with lower b-waves seen about 1½ hour after daybreak.11
5. Size of the pupil
ERG recordings are best done under good pupillary dilatation; miotic pupils can cause sub-optimal illumination of the retina causing decreased amplitudes.
6. Media opacities
Opacification of the lens or vitreous hemorrhage can reduce the amplitudes of ERG a-wave and b-wave.
Clinical Applications
The most common indications of ERG in a retina clinic are tabulated (Table 2) below
|
S No |
Photoreceptor Dysfunction |
Diseases of the inner Retina |
Macular Dystrophy |
|
1 |
Retinitis Pigmentosa |
Congenital Stationary Night Blindness (CSNB) |
Stargardt’s disease |
|
2 |
Cone Dystrophy |
Retinal vein occlusions |
Fundus flavimaculatus |
|
3 |
Cone Rod Dystrophy |
Retinal artery occlusions |
Best’s vitelliform disease |
|
4 |
Rod Monochromatism |
Ophthalmic artery occlusion |
Pattern Dystrophy |
|
5 |
Lebers Congenital Amourosis |
Cancer associated retinopathy |
Drug toxicities |
Table 2. Common indications of ERG
The most common clinical scenario in which ERG is utilized is to evaluate a patient complaining of night blindness. Table 3 below depicts the ERG features of various congenital disorders presenting with night blindness.
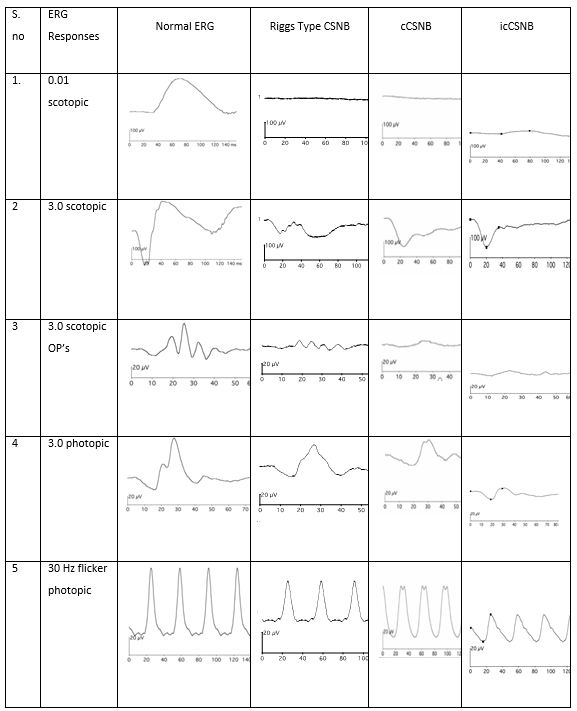
Table 3. Different ERG waveforms were seen in various types of congenital stationary night blindness conditions
The Congenital Stationary Night Blindness (CSNB) includes a heterogenous group of congenital disorders in which the patient presents with night blindness. It is important to recognize these because these are non-progressive as against the photoreceptor dystrophies which can progress to cause severe visual handicap over a period of several years. This group of disorders is classically divided into
- CSNB with normal fundi
- CSNB with abnormal fundi
- Oguchi’s disease
- Fundus albipunctatus
CSNB with normal fundi. A clinically and genetically heterogeneous group of disorders due to a defect in rod photoreceptors or in signal transmission from the photoreceptors to the bipolar cells (post-transduction defect)
Full-field ERG in CSNB may be of two types:
Type 1 (Riggs type): These are patients with a mutation in RHO, SLC24A1 gene causing a rod photoreceptor defect. Absent Scotopic ERG with preserved photopic responses are seen in these patients. Patients have a normal visual acuity with no signs of myopia or nystagmus.
Type 2 (Shubert-Bornshein type): These patients are characterized by the presence of myopia, nystagmus with a tessellated appearance of the retina with tilted discs. These are further divided into complete CSNB (cCSNB) and incomplete CSNB (icCSNB). ERG in cCSNB shows nonrecordable 0.01 response rod specific scotopic ERG and absent b-wave in the scotopic 3.0 response ERG (giving the classic negative wave) due to ON-bipolar cell dysfunction. Characteristic photopic waveforms are seen with broad a-wave and b-waves and absence of OP’S on the photopic b wave.
The ERG in icCSNB is characterized by a recordable but delayed and hypo-volted rod b-wave response in scotopic ERG; photopic responses also reveal decreased a and b wave amplitudes on 3.0 photopic ERG with subnormal 30 Hz flicker cone responses which may in some cases show bifid waves. This is due to the subnormal activity of both ON and OFF bipolar cells. Other conditions causing negative ERG are tabulated in Table 4.
Oguchi’s disease caused by defects in the Arrestingene, is characterized by a peculiar grey white discoloration of the retina, giving it a metallic sheen which disappears after prolonged dark adaptation to reappear again on exposure to light (Mizuo’s phenomenon). Rod mediated scotopic b-wave ERG is reduced in 3.0 scotopic response (negative ERG) with a normal 3.0 photopic and 30 Hz flicker response.
Fundus Albipunctatus reveals innumerable tiny white dots all over the fundus from the periphery to the center. Normal caliber retinal vessels and normal optic disc distinguish it from retinitis punctata albescence. Delay in the regeneration of rhodopsin is the underlying pathology. Though ERG on initial examination shows hypovolted rod responses, these improve on prolonged dark adaptation. Cone mediated ERG, visual acuity and color vision are usually normal (Table 3).
|
S No. |
Retinal disorders |
|
Congenital retinal disorders |
|
|
1. |
Congenital Stationary Night Blindness |
|
2 |
X-Linked Retinoschisis |
|
3. |
Juvenile Batten disease |
|
4. |
Mucolipidosis |
|
Acquired retinal disorders |
|
|
5. |
Central retinal artery or venous occlusion |
|
6. |
Birdshot Chorioretinopathy |
|
7. |
Melanoma associated retinopathy Carcinoma associated retinopathy Diffuse unilateral subacute Neuroretinitis Siderosis |
Table 4. Causes of Electronegative ERG
Specialized Types of ERG:
Early Receptor Potential: It is a very early negative response seen much before the a-wave. It is elicited by an intense bright stimulus and is generated by both rods and cones though the predominant contribution is from the cones (60-70%). It is used mostly as a research tool with minimal clinical application.
C-Wave: It is generated by hyperpolarization of the RPE in response to light and occurs very late (2-4 seconds after the stimulus). It is a cornea positive wave.
Bright –flash ERG is obtained in response to a very bright stimulus and is used to assess the retinal function in opaque media. A moderate response to high-intensity stimulus indicates the presence of some useful retinal function. It has been used clinically to prognosticate the outcomes of vitrectomy in eyes with dense vitreous hemorrhage.12
Long Duration ERG: When the stimulus duration of the ERG is more than 100ms a cornea positive d wave is visible after the b-wave in photopic ERGs. It has been used by researchers in diseases like CSNB to distinguish between the responses from the on and off bipolar cells.
S cone ERG:The S cone function can be separated from L and M cone function if the short-wavelength stimulus is used with orange background illumination. This is helpful in certain disorders where the cone population is not normal such as enhanced S cone syndrome.
Electrooculogram
History
Du Bios Reymond in 1948 discovered that there is a flow of electric current between the cornea (which was relatively positive) and the posterior pole (which was relatively negative) called the standing potential. 13 Elwin Marg in 1951 first measured this resting potential of about 6 millivolts and described it as electrooculogram.14 Arden developed the first clinical application by comparing amplitudes in light and dark-adapted states.15
Origin:16
Electrooculogram is the electrophysiological response recorded from the outer retina in dark and light. It measures the corneo-fundal potential, with the front of the eye being electropositive compared to the back. It originates in the retinal pigment epithelium which is a single layer of cell separated from the photoreceptors by the subretinal space. Though RPE itself is not light responsive, when the photoreceptors are activated release of transmitter substance into the subretinal space causes electrical responses in RPE. Thus the light –insensitive part of the EOG (dark trough) depends on the integrity of the RPE but is independent of the retinal photoreceptors whereas the light-sensitive (light rise) is generated by intact photoreceptors causing depolarization of the basal membrane of the RPE. The light rise is absent in eyes with retinal detachment.
Recording protocol
Patient preparation:
The pupils should be dilated maximally so that the retinal illumination is constant. In the case of non-dilating pupils, the luminance may be increased to achieve a uniform effect.
Electrodes used are silver-silver chloride or gold cup skin electrodes placed on the outer canthi and on either side of the nose after preparing the skin. The ground electrode is usually placed on the forehead. The impedance levels should not exceed 5 ohms. The recordings are affected if the inner canthi electrodes are placed very close to each other. If the electrodes are too close, EOG potentials from one eye can affect that of the other eye (crosstalk).
The Ganzfeld is used as a stimulator with fixation lights located 15 degrees left and right of the center. The dark phase is recorded in darkness with dim fixation lights and the light phase is recorded under photopic condition (luminance of 100 cd/m2) with bright fixation lights. As the patient moves the eyes to look at the fixation lights, the horizontal movement of the eye (Figure 8), produces a shift in the electrical potential to be measured. Wherever the patient moves the eye, the closer electrode to the cornea side, becomes more positive and the electrode in the other canthus becomes more negative. Care should be taken that patient does not move the head to see the lights, which will result in an unreliable report. The dark phase is recorded after total darkness for 15 minutes followed by light phase after turning the lights on.17 Recordings are done for 10 seconds in a minute during the alternating movements of the eyes for at least 15 minutes to register the light peak. Peak amplitude recorded in dark is smaller and is called dark trough; peak amplitude recorded in light is called the light peak.
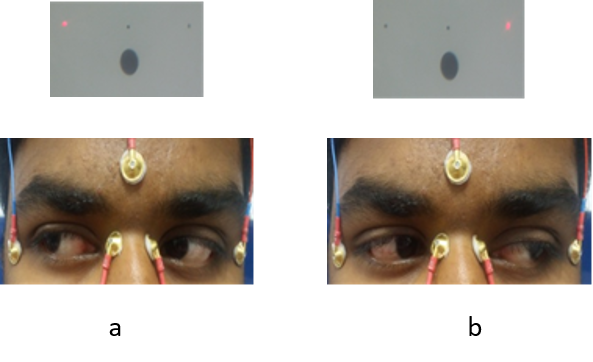
Figure 8: Patient moving both eyes right (a) then left (b) according to the target
Physiological factors affecting EOG recording
Patient compliance is very essential for proper recording. Patients with poor fixation, double vision, central scotoma, ocular motility problems, nystagmus, photophobia and monocular profound visual impairment will have an unreliable recording.18 Even for otherwise normal patients, recording is often affected by poor attention span and fatigue as the test duration is at least 45 minutes.
Interpretation
The EOG amplitude is measured in microvolt after removing artifacts. The Arden’s ratio is calculated as the ratio between light peak and dark trough. The reporting should include Arden’s ratio, dark trough amplitude, and time taken for light peak, pupil size and type of light adapting source used. Arden’s ratio less than 1.8 are abnormal and greater than 1.8 are considered normal (Figure 9).
The reporting should also contain information about patient compliance, which can alter the reliability of the result (Figure 10).
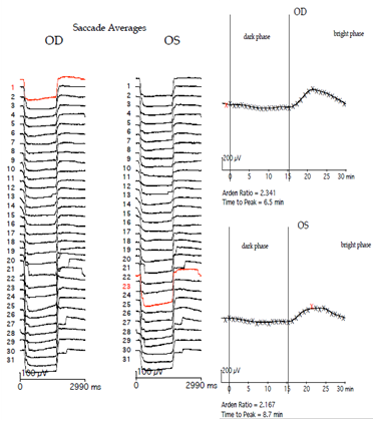
Figure 9 a: Normal Arden’s ratio,
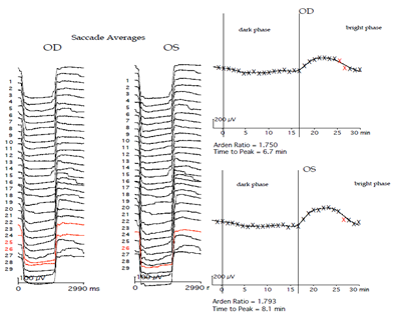
Figure 9b: Abnormal Arden’s ratio (Improper Saccades are shown in red color and eliminated for curve fitting)
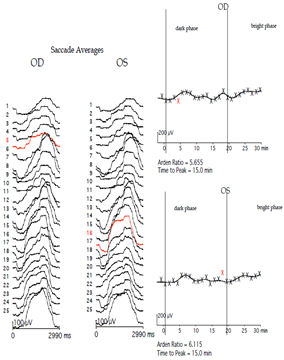
Figure 10: Unreliable EOG report due to abnormal saccades
Clinical implications
EOG like ERG is also a mass response of the retina, and usually both get affected similarly in diffuse diseases of the RPE-photoreceptor complex. The notable exception to this is the group of diseases caused by the Bestrophin gene where EOG may be abnormal even in the presence of a normal ERG. This is because the depolarization of the RPE basal membrane in response to light is largely controlled by the Bestrophin gene. The group of dystrophies now identified to be caused by mutations in the Bestrophin gene includes classical Best vitelliform macular dystrophy (BVMD), autosomal recessive Bestrophinopathy (ARB) and autosomal dominant vitreoretinochoroidopathy (ADVIRC), and adult-onset vitelliform macular dystrophy (AVMD). ERG and EOG can be used to differentiate between these dystrophies19-22 as shown in Table 5.
|
BVMD |
ARB |
AVMD |
ADVIRC |
|
|
EOG |
Reduced light rise |
Reduced light rise |
Normal |
Reduced light rise |
|
ERG |
Normal |
Mildly reduced rods and cones |
Normal |
Severely reduced rods and cones |
Table 5. Electrophysiological findings in Bestrophin gene mutation dystrophies
Electrooculogram is also affected in photoreceptor layer disorders such as Stargardts disease, retinitis pigmentosa, cone dystrophy and cone-rod dystrophy. The EOG is usually normal in cases of CSNB and is a very useful finding to differentiate it from other progressive disorders causing night blindness.
Pattern Electroretinogram
History
The Pattern ERG (PERG) was first recorded by Riggs.23 The PERG is evoked by changes in stimulus contrast, unlike full-field ERG.
Recording Protocol
It is recorded as per ISCEV standards.24 Non-contact lens electrode like the DTL which does not interfere with the optics of the eye is used as an active electrode with a reference electrode at the ipsilateral outer canthus and ground electrode at the forehead. Undilated binocular recordings are taken with refractive error correction in place. The stimulus is a black and white reversing checkerboard. The mean luminance of the stimulus remains constant during reversals and the contrast between the black and white checks is maintained at 100%.
Origin and Interpretation of waveforms in PERG
PERG is primarily used to differentiate between optic nerve disorders and macular disorders. It can be transient (produced by alternating reversal of a checkerboard pattern at a reversal rate of <6 reversals per second or 3 Hz) or steady-state(produced by a reversal rate of >10 reversals per second or 5 Hz). A normal PERG has two main components: P50 (positive component appearing at 45-60 ms) which shows macular photoreceptor function and N95 (larger negative component appearing at 90-100 ms) which shows retinal ganglion cell (RGC) function. A smaller negative wave N35 precedes the P50. Fixation is critical for a good PERG record; hence it cannot be used in patients with poor visual acuity. Figure 11 below shows a typical PERG waveform with the amplitude and implicit times of the P50 and N95.
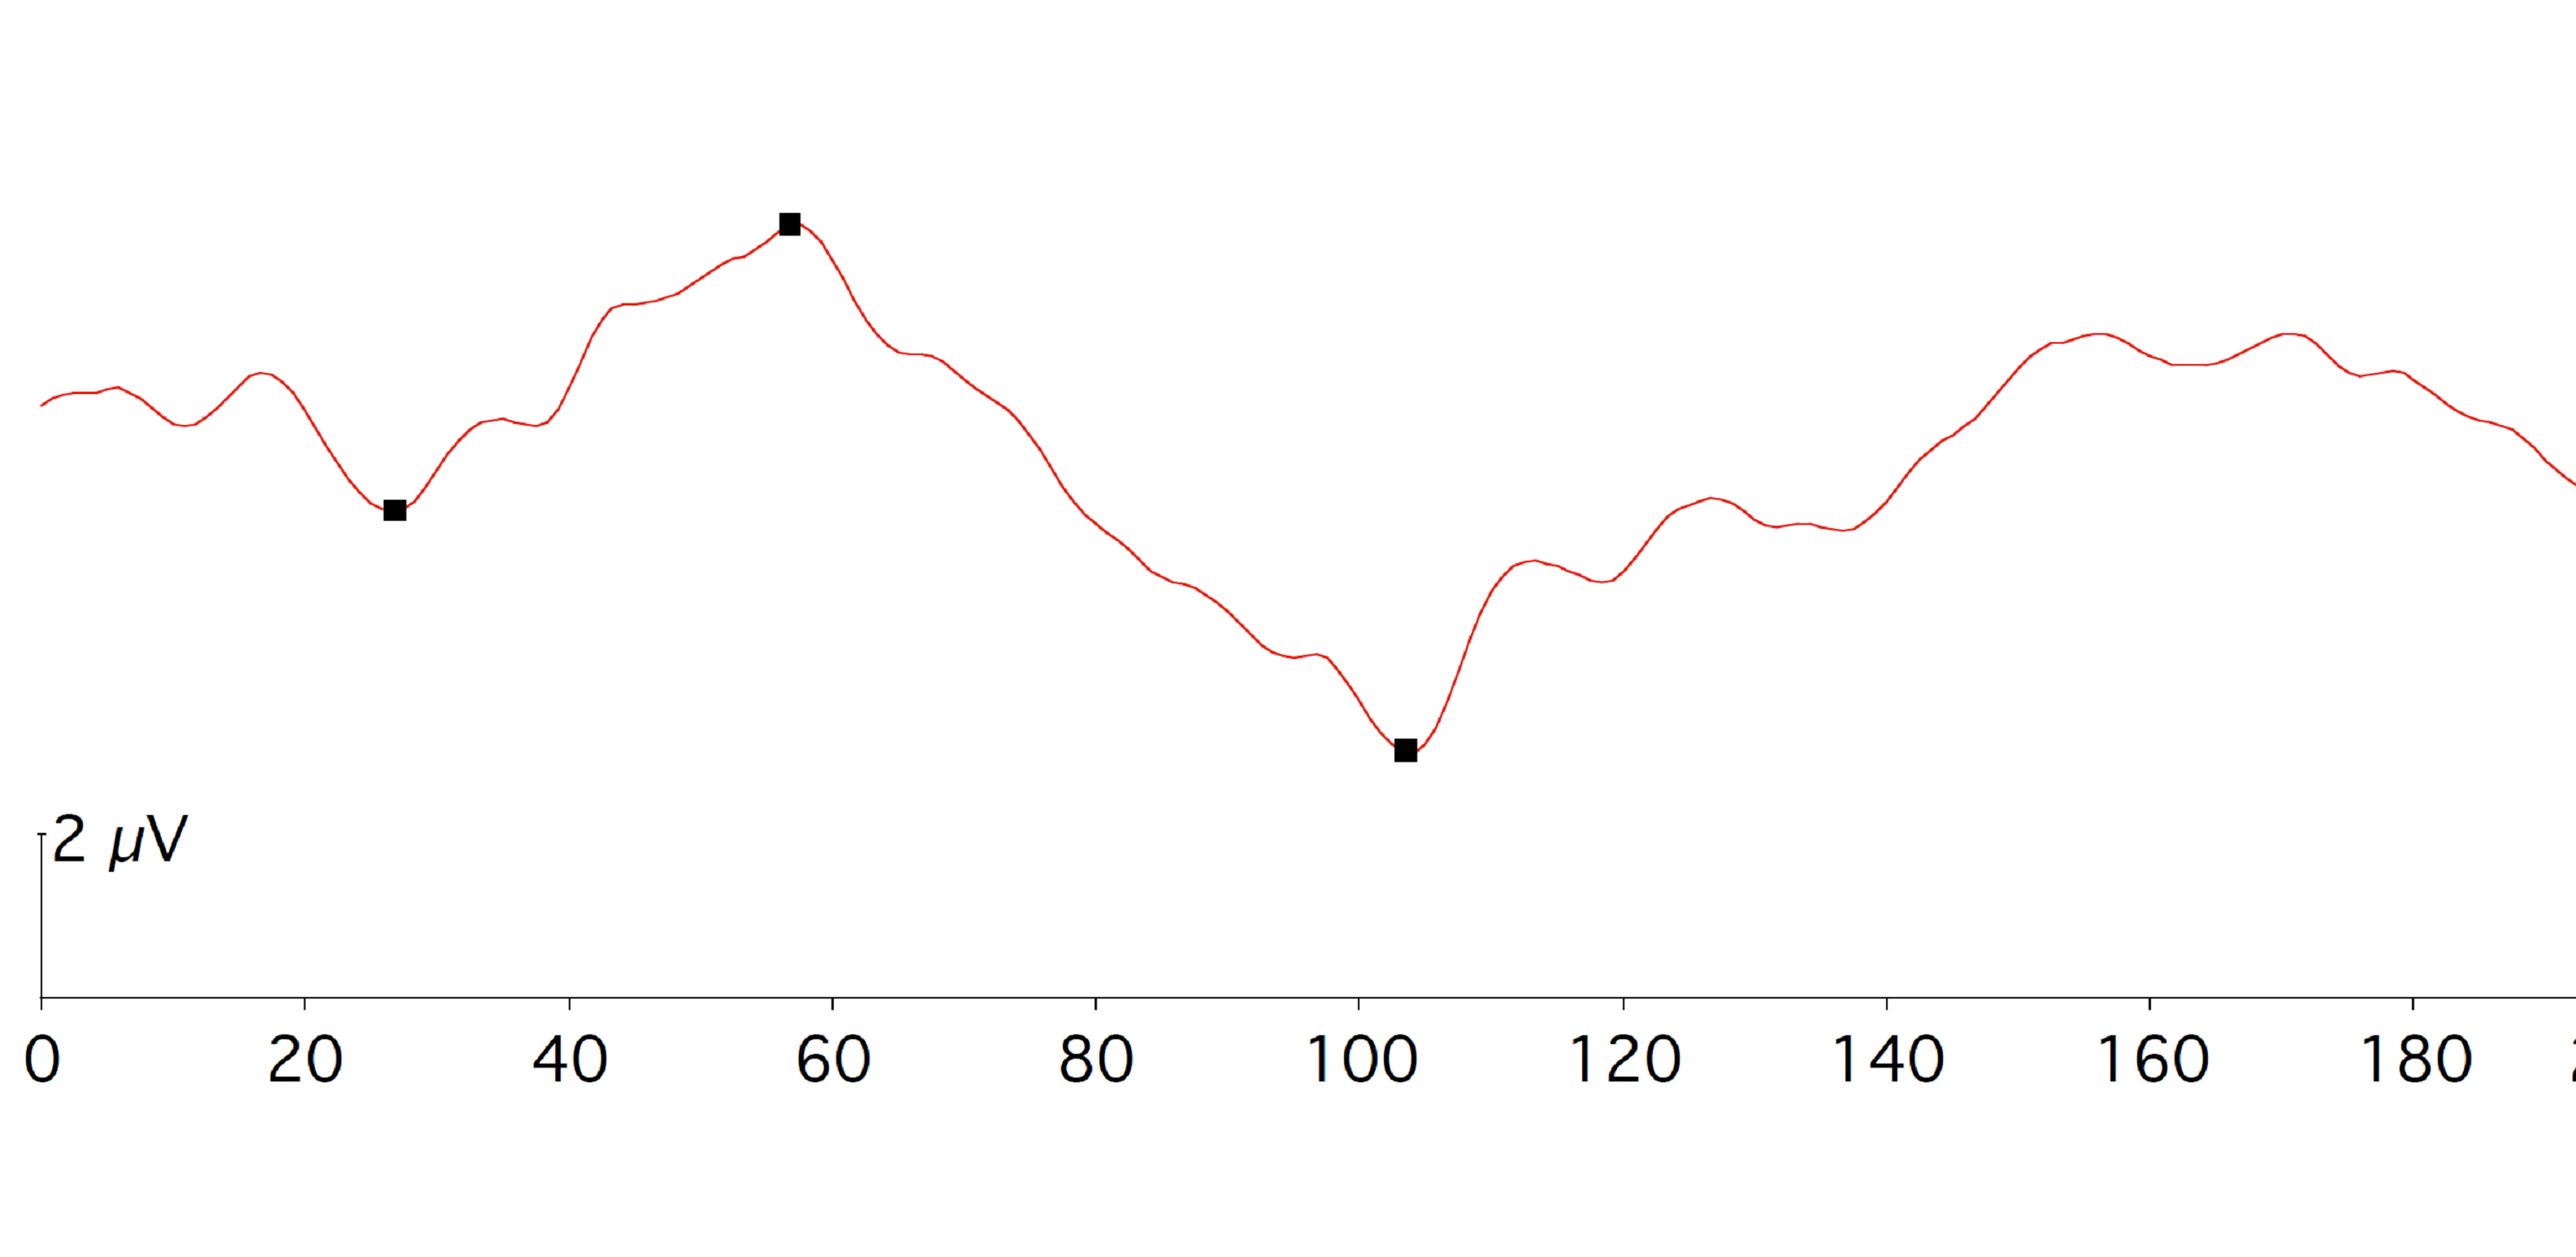
Figure 11: Normal waveform of PERG showing N35, P50 and N95 component
Clinical Applications
P50 component of PERG which reflects the macular function is complementary to full-field ERG. A normal ffERG with a decrease in the P50 amplitude depicts localized macular dysfunction as seen in patients with hereditary maculopathies, macular hole, and age-related macular degeneration. An abnormal ERG with an abnormal PERG points towards a generalized retinal disorder with macular involvement. Completely extinguished PERG may occur in macular dysfunction but is rarely seen in optic nerve dysfunction. Selective affection of the N95 component, with a near-normal P50 wave points towards optic nerve pathology. N95/P50 ratio remains unaltered in macular diseases but decreases in optic nerve disorders. N95/P50 ratio is a more sensitive marker for optic nerve disorder than PERG amplitude.25 Though PERG can differentiate between a retinal and an optic nerve disorder it does not give us the topography of the disease process.
Multifocal Electroretinogram
ffERG being a mass response does not provide insight into focal retinal function. MfERG stimulates various focal areas of the retina at the same time and picks up focal disease as well as maps the disease distribution using the multi-input system analysis technique.26
History
The technique of the MfERG was developed by Erich Sutter using cross-correlation with binary m-sequences.27 The basic guidelines that are used worldwide for recording MfERG have been published by ISCEV in 2012.28
Origin of waveforms in MfERG
MfERG allows a common stimulus of hexagonal arrays to stimulate the various focal areas simultaneously. Each hexagon of this stimulus reverses in contrast and at any given time, each hexagon has a 50% chance of being light or dark. The MfERG is recorded under photopic conditions and hence is primarily cone system is driven with contributions from the cone photoreceptors as well as from ON and OFF-cone bipolar cells. No contribution from the ganglion cell layer is seen.
The response that is obtained by the presentation of the hexagonal stimulus is called the first-order kernel response. It is not a true response but a mathematical extraction. The response from the retina is determined not only by one stimulus presentation but also by adaptation to the previous flashes or successive flashes. This is represented in the second-order kernel responses. The first slice of the second-order kernel measures the effect of a flash immediately preceding while the second slice of the second-order kernel measures the effect of the flash two frames away.29
For most of the clinical conditions, it is first-order kernel responses that are used.
Recording Protocol
Stimulus
MfERG is recorded using a corneal electrode as in conventional ERG but it is the stimulus and analysis program used which produces a topographic map of electric responses. The stimulus source is delivered by a cathode ray tube (CRT) with a frame frequency of 75 Hz. The luminance of the stimulus elements on the CRT screen is 100–200 cd/m2 in the lighted state and <1 cd/m2 in the dark state with an average luminance of 50–100 cd/m2 during the entire testing period.30
The stimulus display consists of 61, 103, 241 or 509 hexagons subtending a visual angle of 20 – 30 degrees on either side of fixation. Each hexagon is scaled to stimulate the same number of cones e.g. cone density is higher at the fovea, so the hexagons are smaller in the center as compared to those in the periphery. Each hexagon flashes according to a pseudo-random sequence known as the “m-sequence”. The contrast between the lighted and darkened stimulus elements should be at least 90% with the mean luminance of the screen at any given time being relatively the same (equiluminant). This sequence is recommended for routine testing; different sequences, like the inclusion of global light or dark frames, can also be used for specialized testing.31 Signal analysis is done digitally with artifact rejection before a report is generated.
Recording electrodes
Contact electrodes like the Burian-Allen contact lens or DTL electrodes are used. The signal-to-noise-ratio is better and artifacts minimal with Burian-Allen electrodes. But the edge of the contact lens of Burian-Allen electrodes can cause prismatic effects if the lens does not fit perfectly.30 The amplitude of MfERG with the DTL electrodes is smaller though the patient comfort and cooperation are more. The reference electrode for DTL is at the orbital rim and the ground electrode at the forehead or ear.
Recording Procedure
The clinical protocol should be according to ISCEV guidelines. The recording is done in a light-adapted state after pupillary dilatation with the patient seated comfortably in front of the stimulus. Viewing distance and fixation should be monitored throughout. Fundus photography if done before MfERG testing 15 minutes of light adaptation should be given. A 61 array recording may take 4 min and 103 arrays recording up to 8 minutes. Larger stimulus elements as seen in a 61 array give signals with less noise but small areas of retinal dysfunction can be missed. Smaller stimulus elements e.g. 103 will more accurately outline dysfunctional areas, but require longer recording time which may reduce patient compliance.
A mfERG report provides three essential protocols such as traces (Figure 12A), ring averages (Figure 12B), and response density topography (Figure 12C). The MfERG trace arrays give ERG response of each retinal location and this must form a part of all standard protocols. Group averages are useful in comparing quadrants, or rings (foveal, parafoveal, and perifoveal) from the center to periphery thus allowing the evaluation of distribution pattern and topography of the disease. A topographic plot reflects the overall signal strength per unit area of retina giving the clinician a quick overview of the distribution of the retinal pathology but individual waveforms are lost.
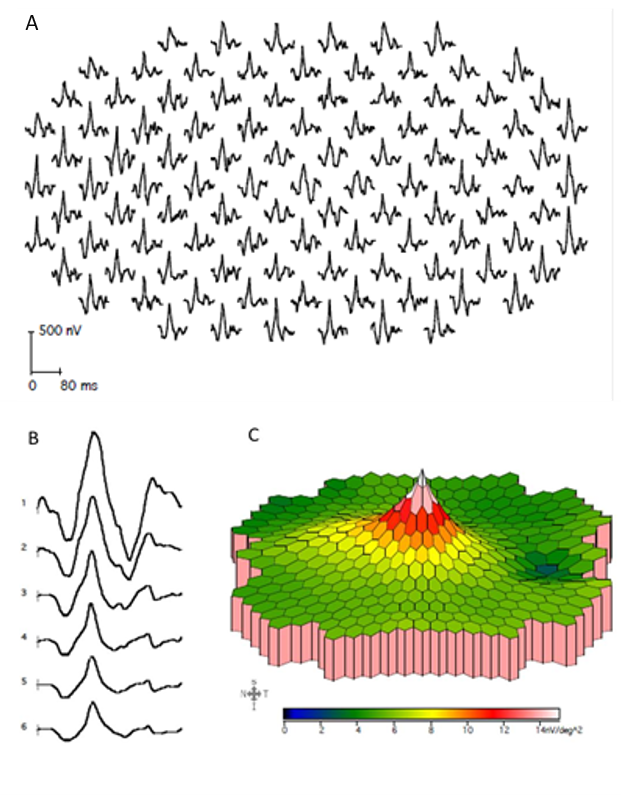
Figure12: A) Traces of MfERG responses of each location, B) ring averages and C) response density topography
A typical basic mfERG waveform consists of initial negative wave followed by a positive peak, after which another negative deflection can be noted called N1, P1 and N2 respectively (Figure 13).
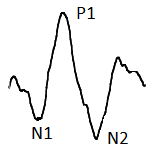
Figure 13: A typical MfERG markings consist of N1, P1 and N2
Physiological factors affecting MfERG
The MfERG implicit times increase and amplitudes decrease with age (approximately 5% per decade, varying from 3.3% (peripherally) to 7.5% (perifoveally) 32, 33 as well as with the degree of myopia.9,34
Clinical Applications
MfERG is useful in various retinal disorders. ffERG is vital in the diagnosis of diseases like RP and XLRS and mfERG is used to look for the progression of the disease in these disorders. As the disease progresses more areas get involved along with a decrease in amplitude and increased implicit times.35, 36 While a decrease in amplitude, as well as increased implicit times, are seen in hereditary maculopathies like Stargardt's disease 37, and Best dystrophy; 38 predominant decreased amplitudes are seen in full-thickness macular hole. In Central Serous Chorioretinopathy; mfERG has improved our understanding of the disease. Though fluid accumulation may be confined to the macula the retinal responses are affected widely pointing towards a more generalized pathology. Persistent functional impairment of the retina was found in form of delayed implicit times on mfERG in patients with CSCR even after the resolution of subretinal fluid. Amplitudes did show improvement with the resorption of fluid. 39
The role of mfERG in the evaluation and follow up of patients with drug toxicity is vital. Retinal toxicity especially in the early stages of the disease may not be easily picked up on ffERG. MfERG is the investigation of choice here. The mfERG detects retinal toxicity earlier than visual acuity testing, color vision testing, or Amsler grid testing.40 In contrast to perimetry, mfERG being an objective test, can give useful information in an uncooperative patient as well. Toxicity due to Hydroxychloroquine causes reduced amplitudes as well as increased implicit times of N1 and P1 waveforms. Depression of signals in the perifoveal region is seen first followed by the peripheral retina. Even patients with normal visual acuity and no fundus abnormalities can have abnormal mfERG responses. Four patterns of distribution of subnormal mfERG amplitudes have been observed by Maturi et al: (1) paracentral loss, (2) foveal loss, (3) peripheral loss, and (4) generalized loss. Response densities have been shown to improve after cessation of hydroxychloroquine in the early stages.41 The risk of retinal toxicity is dependent on the daily dose, duration of medication, and other risk factors such as the presence of renal disease and the simultaneous use of tamoxifen. The guidelines for screening as recommended by the American Academy of Ophthalmology 42 are enlisted in Table 6 below.
|
Screening Guidelines |
|
|
Baseline Screening |
Fundus Examination within first year of use |
|
Automated Visual Fields |
|
|
Spectral domain OCT |
|
|
Multifocal ERG |
|
|
Fundus autofluorscence |
|
|
Annual Screening |
Start after 5 years of drug intake |
|
Earlier if any of the risk factors present |
|
Table 6. The guidelines for screening for retinal toxicity recommended by American Academy of Ophthalmology
Few examples of MfERG responses in various retinal disorders are given in figure 14 below
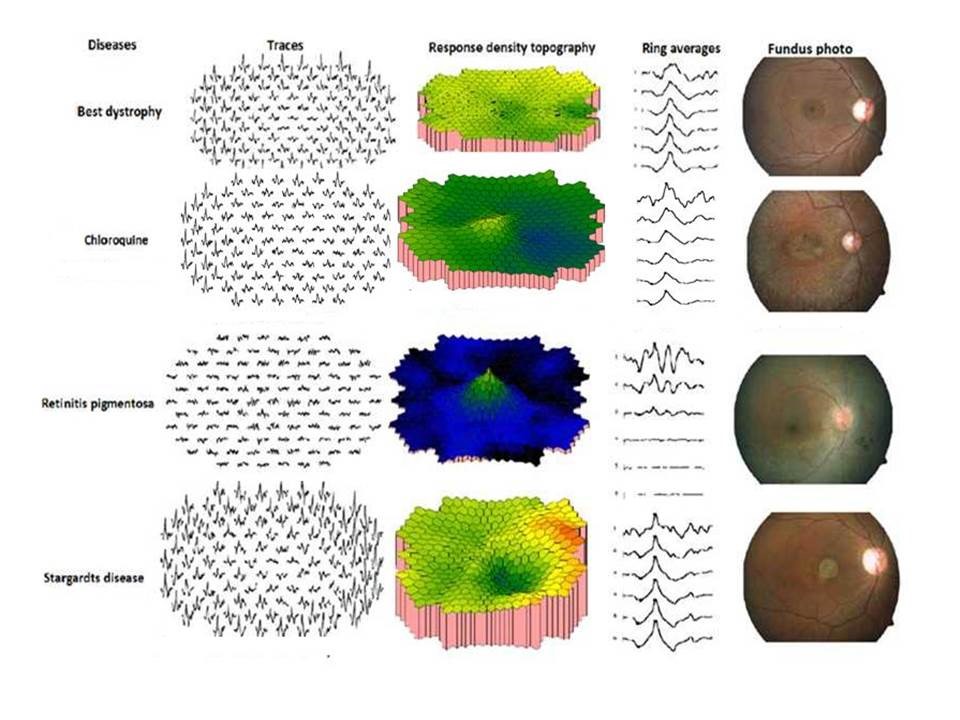
Figure 14: MfERG responses of different retinal disorders
Photopic Negative Response
History
Electroretinogram has always been thought to have no contribution from the RGCs. RGC activity was first observed in cone electroretinogram by Viswanathan et al in 1999.43 A negative wave was observed following the b wave called the photopic negative response (PhNR). It was elicited using red flashes over blue background 43 (R/B PhNR), white flash on white background W/W PhNR44, or blue stimulus on yellow background (B/Y PhNR).
Recording protocol
PhNR recording is done with pupillary dilatation and light adaptation. Electrode placement is similar to that used for ffERG. White (of various intensities), red or blue stimulus is then used to elicit PhNR.
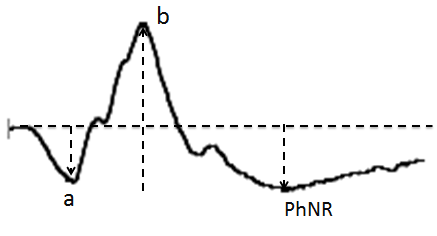
Figure 15: Normal PhNR waveform
PhNR interpretation
PhNR is the slow negative wave observed after the b-wave, in a photopic ffERG (Figure 15). Sometimes a small positive peak can be observed between b-wave and PhNR which is the “i-wave”. The origin of the i-wave is still not clear but many believe that this wave originates from the off-pathway.45 The most commonly used PhNR parameter is PhNR amplitude baseline to trough of the negative wave after the b-wave. Also, b-wave peak to the trough (PT) and amplitude at the average implicit time (BF) is also used by many clinicians (Figure 16). Of these b-wave peak to the trough (PT) has been found to be the most reliable and repeatable measure for PhNR.46
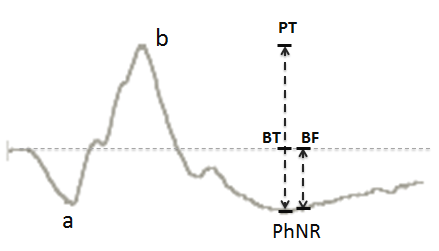
Figure 16: PhNR parameters PT = Peak to trough, BT = Baseline to trough and BF = Baseline to fixed point at the average implicit time
Clinical Applications
PhNR in glaucoma
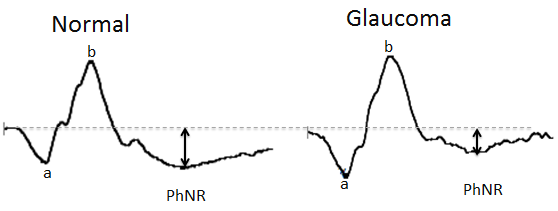
Figure 17: Showing reduced amplitude of PhNR waveform in glaucoma subject as compared to normal subject
After the first published article by Viswanathan et al 43 many studies were done using similar test settings on human glaucoma subjects. In glaucoma the a-wave and b-wave may remain unchanged, but the PhNR gets selectively diminished (Figure 17).47,48 This decrease in amplitudes of PhNR may be seen even in the presence of a normal or borderline visual field mean deviation (MD).49 Unlike perimetry, it does not require active participation and co-operation of the patient.
PhNR being a global response may not be suitable for localized defects and hence stimuli in different locations of the retina are used to obtain a focal PhNR. This may be more sensitive than full-field PhNR in early and moderate glaucomatous damage.50
PhNR in diabetic retinopathy
FfERG and MfERG are reduced in advanced stages of inner retinal diseases such as diabetic retinopathy(DR).51-53 In diabetic subjects reduced PhNR amplitude and delayed implicit times are seen even in the early stages of the disease including sub-clinical DR.54-56
Reduction of PhNR amplitude has also been seen in other inner retinal diseases like central retinal artery occlusion,57 and branch retinal vein occlusion (BRVO).58
Visual Evoked Potential
Visual Evoked Potentials (VEP) are derived from Electroencephalographic (EEG) activity of the visual cortex obtained by placing the electrodes on the scalp, and by projecting the visual stimulus (Flash and or Patterns) to generate the electric currents from the brain. VEP is an objective, non-invasive, and quantitative measure of the functional integrity of the entire visual pathway from retina to the visual cortex.59,60 However, most of the contribution to the VEP comes from the macular region as it is represented largely at the visual cortex .61
History
Hans Berger, recorded the first EEG from an intact human skull in 1929, originating from the occipital cortex and demonstrating the alpha and beta rhythms.62 Studies demonstrated that larger and simpler waveforms were seen with suddenly appearing and disappearing patterns or contrast reversal.63,64
Recording Protocol
Clinically performed VEPs follow the standard protocols set by theISCEV.59 VEP recordings are carried out monocularly without pupillary dilatation.
Stimulus: In the clinical setting two types of stimulation flash and pattern are used to elicit VEP.
Flash VEP
A flash VEP is elicited by a uniform flash of light with a strength of 3 cd.s.m2 (Range 2.7 to 3.4 cd.s/m2) and duration ≤ 5 ms subtending at least 20 degrees of the visual field. The flash is presented by a flashing screen, a handheld stroboscopic light, or a Ganzfeld bowl in front of the patient. Flash VEP is performed under dim illumination.59
Pattern VEP
High contrast, white and black checkerboard stimuli is used in pattern VEP. There are two types of stimuli used in pattern VEP.59
- Pattern reversal Stimuli
- Pattern onset/offset stimuli
In pattern reversal VEP, the equal number of black and white square checks (check the width of 1° (0.8°–1.2°) for large squares and 0.25° (0.2°–0.3°) for small squares) on the screen reverse abruptly with a constant mean screen luminance of 40-60 cd/m2 and a contrast between the black and the white check of >80%. Luminance is also uniform throughout the screen. According to ISCEV standard, the pattern reversal rate should be 2 ± 0.2 reversals per second.59 The stimulus subtends a visual field of 15°.
In pattern onset/offset stimulation, the checkerboard pattern is abruptly exchanged with a diffuse screen with the same luminance as that of the average luminance of the checkerboard screen. Checkerboard stimulus characteristics are similar to the pattern reversal in terms of number, width, and contrast of checks. The mean luminance of the screen is 40-60 cd/m2 both during the pattern and diffuse stimulus (Figure 18).
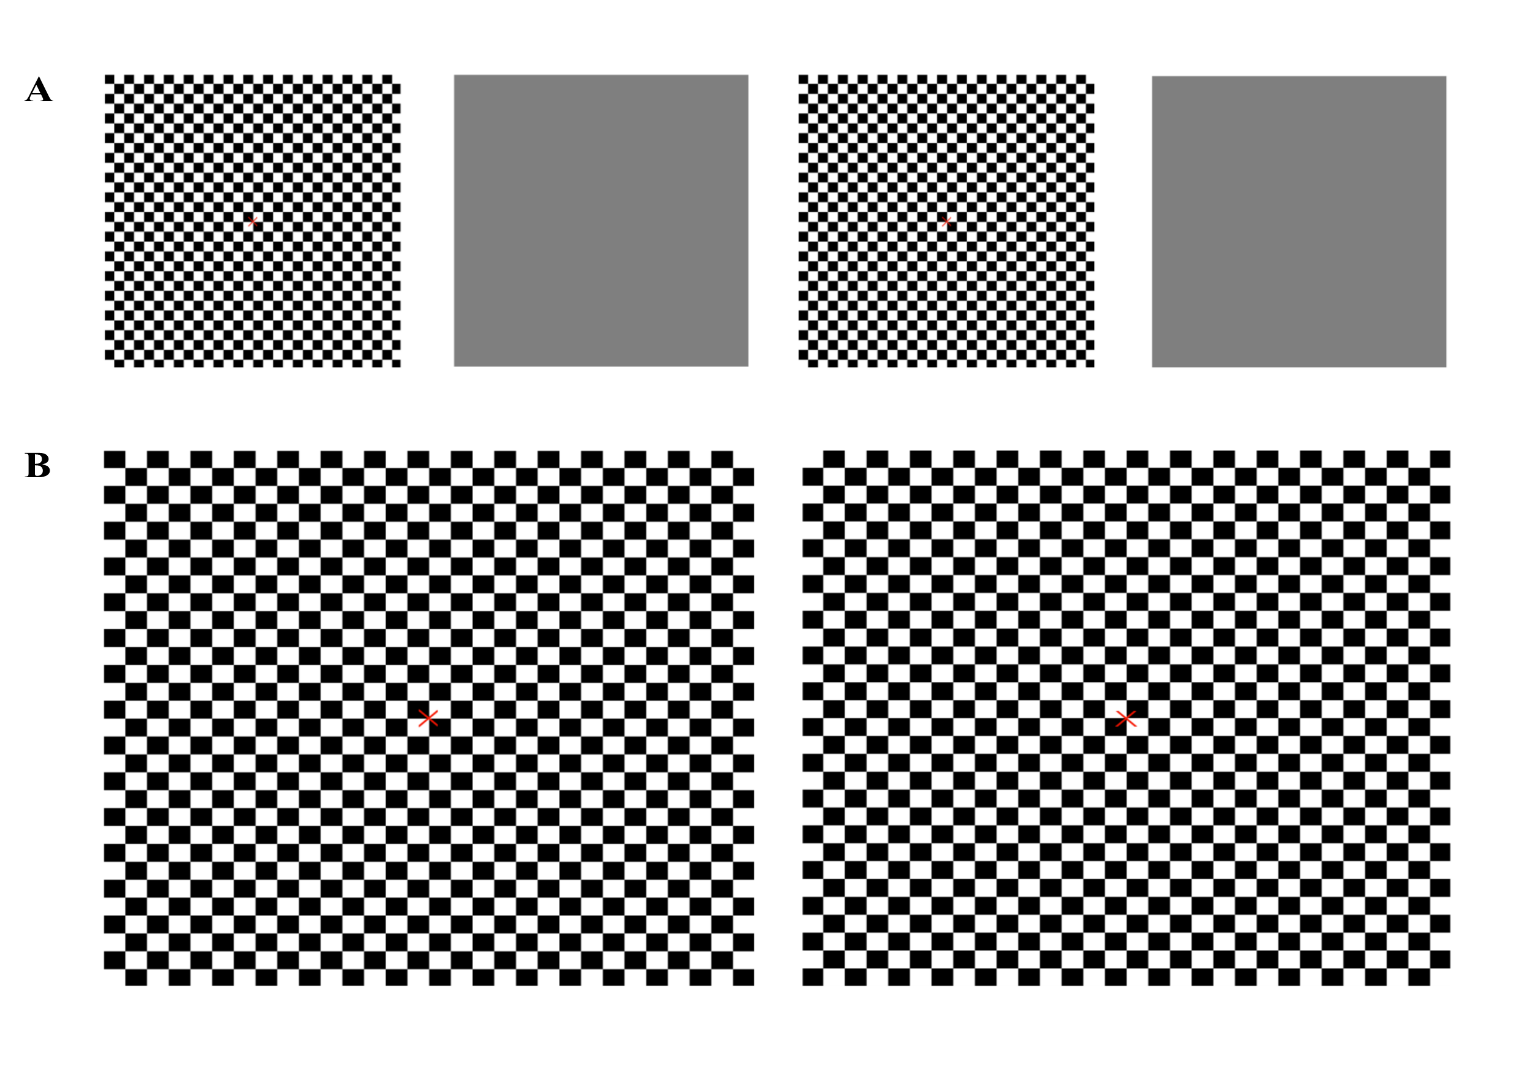
Figure 18 : (A) Stimulus for pattern onset and offset VEP (B) Stimulus for pattern reversal VEP
Equipment
Electrodes
Standard silver-silver chloride or gold cup skin electrodes are used with a skin-electrode with an impedance of <5W. A single recording channel is used with an active electrode in the midline at the occipital scalp overlying the visual cortex and the reference electrode at the Fz (Figure 19) according to the International 10/20 system.65 This measures pre-chiasmal defects in the visual pathway; for post-chiasmal assessment of function multi-channel VEP is required. The respective scalp region has to be adequately cleaned before the electrode is placed along with a conductive paste.
VEP waveforms are quantified by measuring amplitudes and latencies. The entire test must be recorded at least twice for consistency and proper diagnosis.
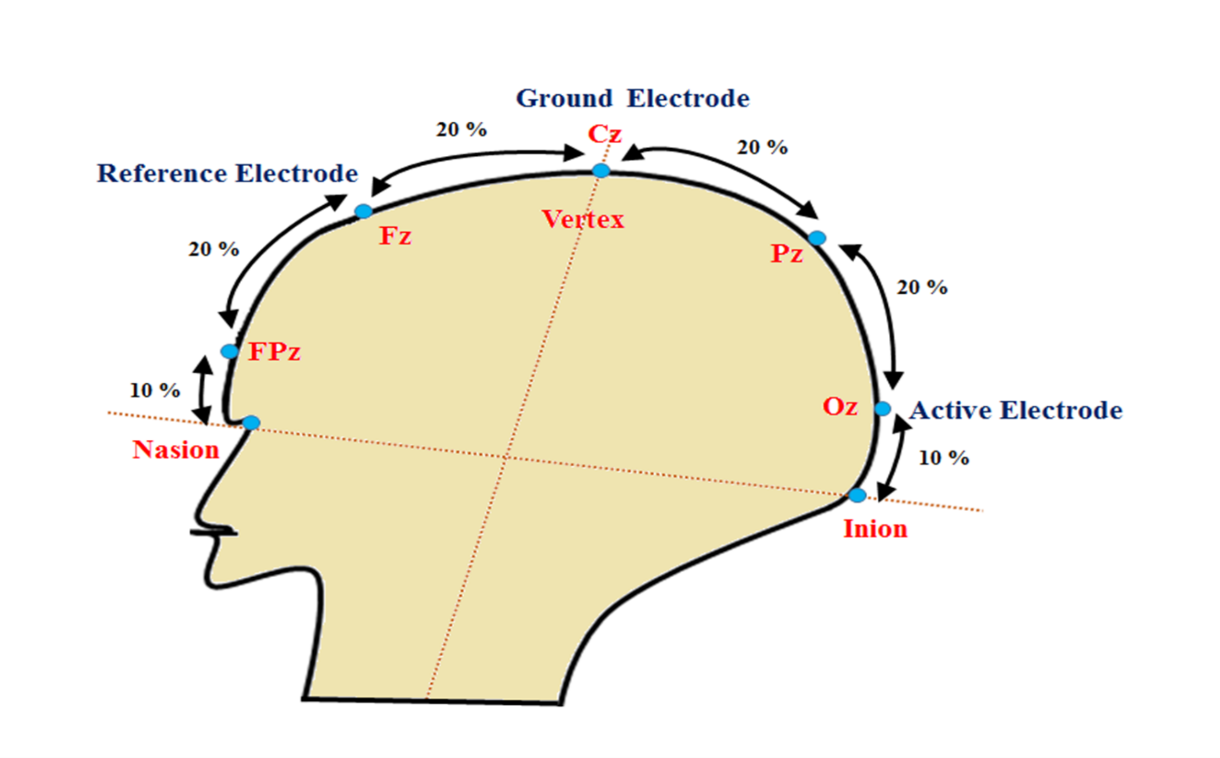
Figure 19: VEP electrode placement system according to 10-20 International system. The scalp electrodes are placed at anatomical bony landmark based on head size. The point between the forehead and nose is Nasion and the external occipital pretubernce at lower part of the skull is Inion. The total distance is measured between Nasion and Inion over the vertex. Active electrode is placed at 10% of the total distance above the inion in the occipital scalp (Oz), the reference electrode is placed at Frontal cortex (Fz), i.e 30% of the total distance from Nasion. Ground electrode is usually placed at vertex (Cz) or forehead, earlobe (Right or left), mastoid region. Here, “z” represents midline position of the head.
Clinical Application:
Flash VEP
Flash VEPs are particularly useful in patients with media haze, poor cooperation, or poor vision in whom pattern VEP cannot be performed. The most important parameter in the analysis of flash VEP is P2 peak time (Time is taken from onset of the stimulus to positive peak at P2 which must be less than 125 ms) and amplitude (measured from negative peak (N2) to positive peak (P2) which must be greater than 10 µV in flash VEP) (Figure 20, 21, 22).
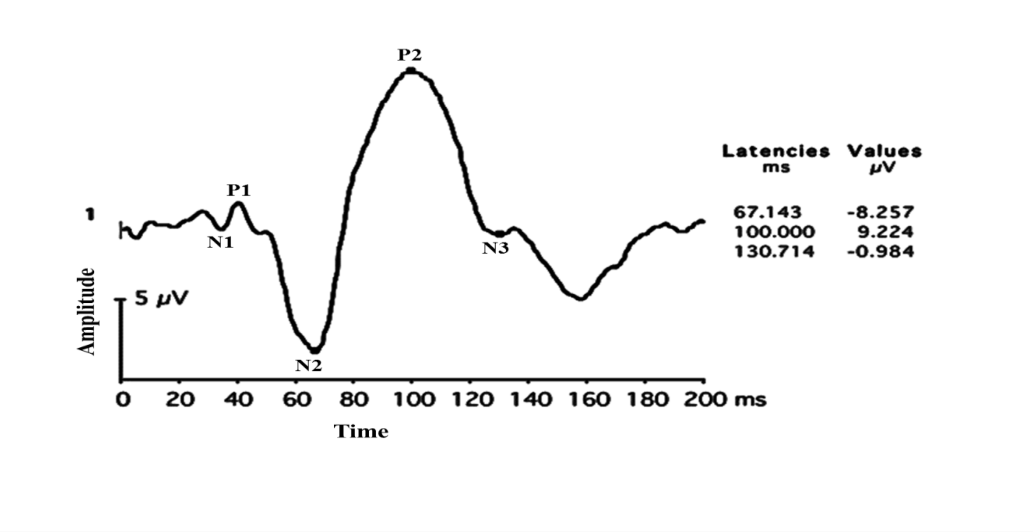
Figure 20: Flash VEP with Normal P2 Latency and amplitude
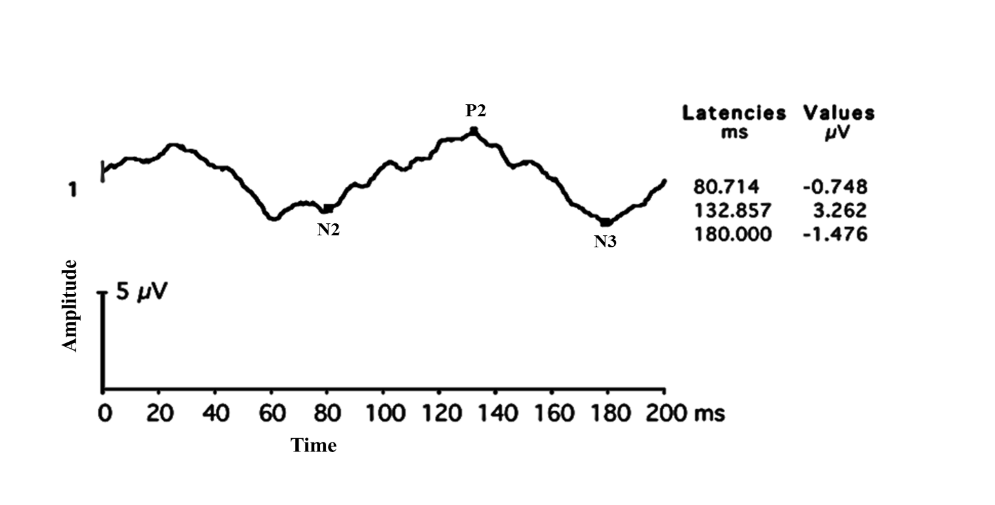
Figure 21: Flash VEP with Delayed P2 latency with reduced amplitude
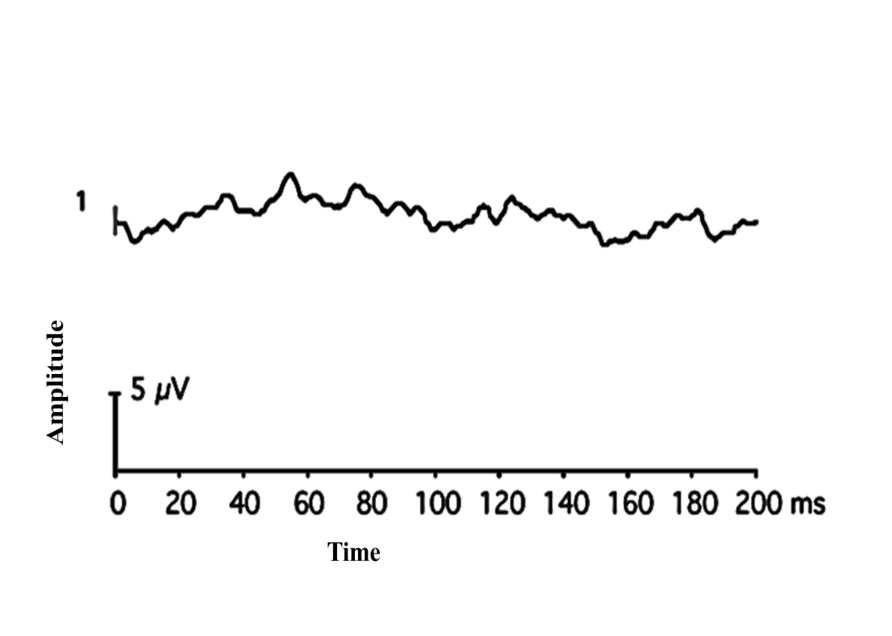
Figure 22: Non-recordable Flash VEP
Since a high degree of inter-subject variability is seen in flash VEP parameters in the normal population, and interocular comparison is commonly used instead of comparison with the normative data.
Pattern VEP
Pattern reversal waveforms have less inter-subject variability and consist of a negative peak of around 75 ms (N75), a positive peak of around 100 ms (P100), and a negative peak of around 135 ms (N135).62,66 Amplitude of P100 peak (Positive peak from N75 to P100) is the most important parameter for analysis. P100 is preceded by a negative waveform of the N75 and followed by another negative waveform N 135. Pattern reversal is the most preferred VEP stimulus type in clinical settings. A typical pattern VEP waveform is shown in Figure 23.
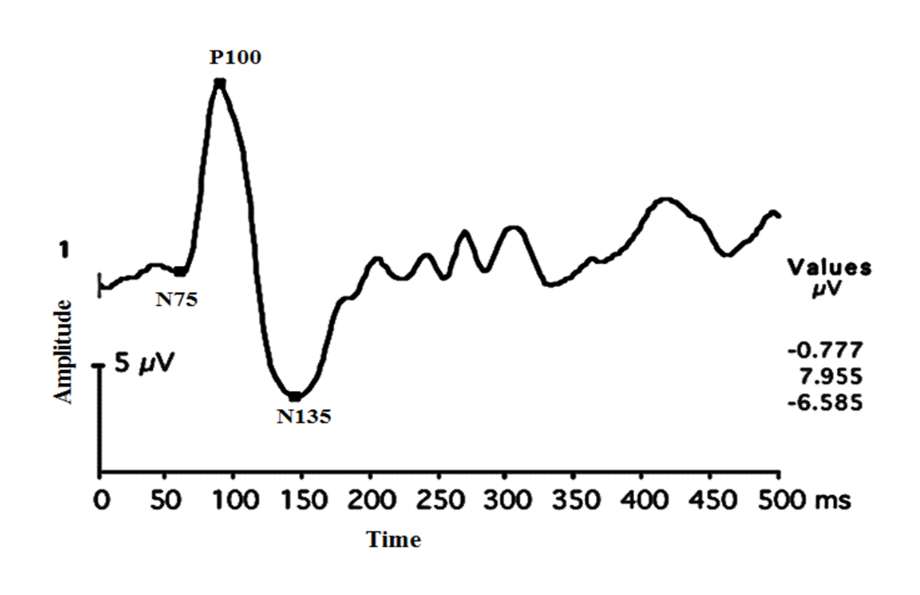
Figure 23: Typical pattern VEP waveforms seen in normal subjects.
Pattern onset/offset VEPs consists of a positive peak at 75 ms (C1), a negative peak at 125 ms (C2), and followed by a positive peak at 150 ms (C3). This technique is particularly useful in the detection of malingering and in subjects with nystagmus. The various clinical indications of VEP are enumerated in table 7 below.
|
Optic nerve atrophy |
Post Brain surgeries |
|
Ischemic optic neuropathy |
Papilledema |
|
Traumatic optic neuropathy |
Optic disc drusen |
|
Toxic optic neuropathy |
Pale Disc |
|
Retrobulbar neuritis |
Meningioma |
|
Intracranial injury |
Migraine |
|
Nutritional Optic Neuropathy |
Pituitary tumours |
|
Optic nerve glioma |
Multiple Sclerosis |
|
Unidentified visual loss |
Malingering |
|
Surgical Monitoring (Intra-orbital and endoscopic sinus) |
|
Table 7. Clinical indications of VEP
Factors affecting the VEP
Age
Dustman and Beck 67 carried out the first flash VEP study in the different age groups. They demonstrated that there was a steady increase in amplitude in the first six years of life, followed by a reduction in amplitude until the age of 15 years, and no alteration in amplitude until the 70 years of age. Each Clinic should have its own normative data for accurate interpretation of amplitude and latencies.
Other factors that affect VEP waveforms include poor fixation, pattern size, pattern contrast, pattern mean luminance, transient luminous artifacts in LCD screen, uncorrected refractive error (pattern VEP), pupillary aperture, external Noise (sound), the unnecessary electric field around the setup, improper positioning of electrodes, frequent blinking during the test, un-calibrated stimulus projectors and amplifiers, media Opacities (pattern VEP), fatigue, patient’s inattention.
VEP under anesthesia
VEP is usually carried out without general anesthesia. Sometimes, VEP is used for surgical monitoring of optic nerve function especially during brain surgeries, intra-orbital surgeries, and intracranial surgeries. During the surgeries, the anesthetic agents used might affect the amplitudes and latencies depending on the type of agent used. 68, 69 Salient features on VEP in the commonly seen optic nerve disorders are tabulated below (Table 8).
|
S.No |
Optic neuritis |
ION |
Compressive lesions |
|
1 |
Marked latency delay |
Latency delay not seen |
Latency delay seen |
|
2 |
Amplitude reduction seen which recovers |
Predominant decrease in amplitude |
Amplitude reduction seen |
|
3 |
Waveform morphology maintained |
Waveform morphology maintained |
Distortion of the waveform seen |
|
4 |
Changes in scalp distribution uncommon |
Changes in scalp distribution uncommon |
Abnormal scalp distribution seen |
|
5 |
VEP changes seen during the disease |
Monophasic |
VEP changes seen during the course of the disease |
Table 8. Features in VEP in common optic nerve disorders
Flash and pattern VEP responses in optic neuritis
Pattern VEP may be more sensitive in picking up an optic nerve disorder in certain situations. It is especially useful in chronic optic neuritis where MRI becomes normal (Figures 24 a and b).
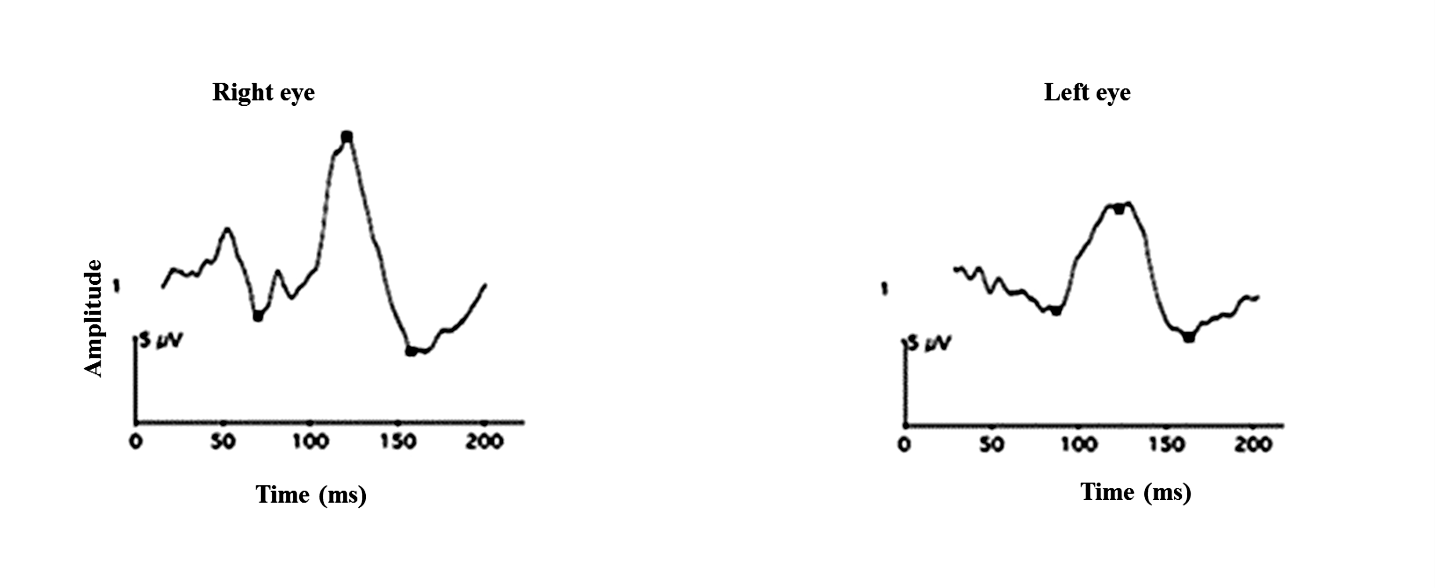
reduced P2 component in the left eye.
The right eye shows PVEP with normal latency
and amplitudes whereas the left eye reveals delayed
waveform with reduced amplitude.
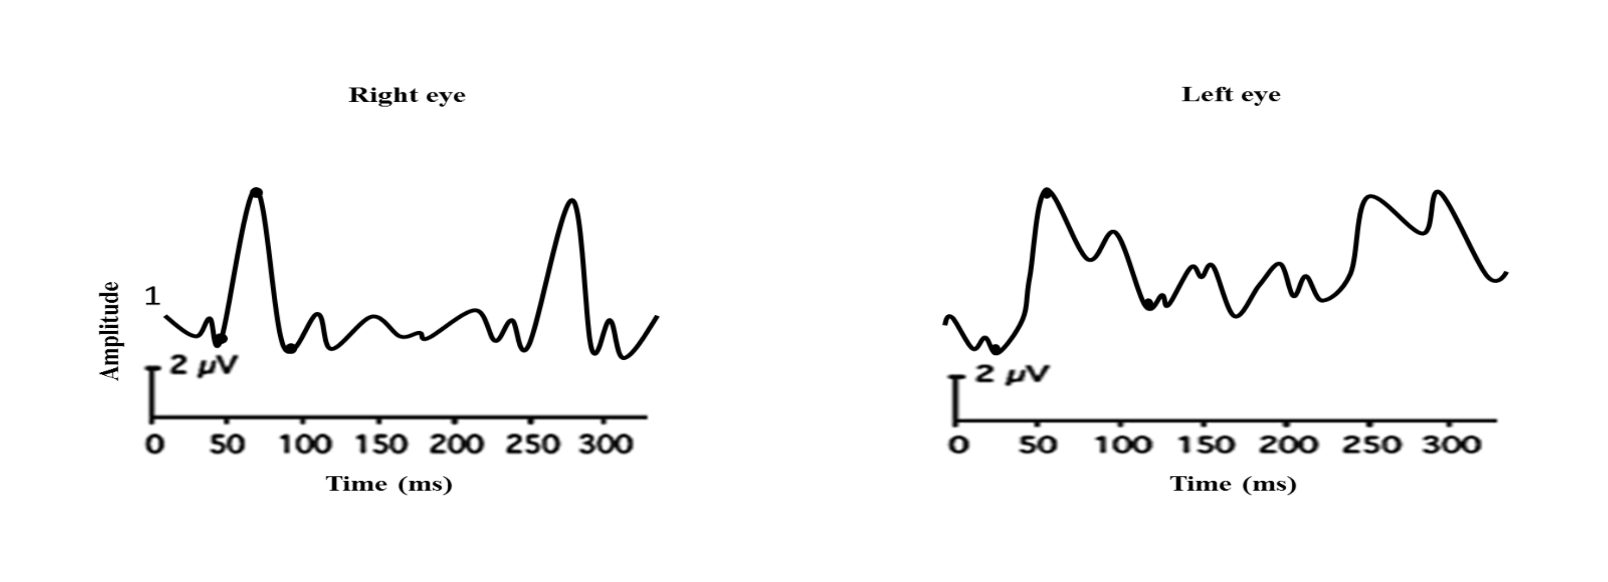
Flash and pattern VEP responses in ischemic optic neuropathy are shown in Figures 25 a and b.
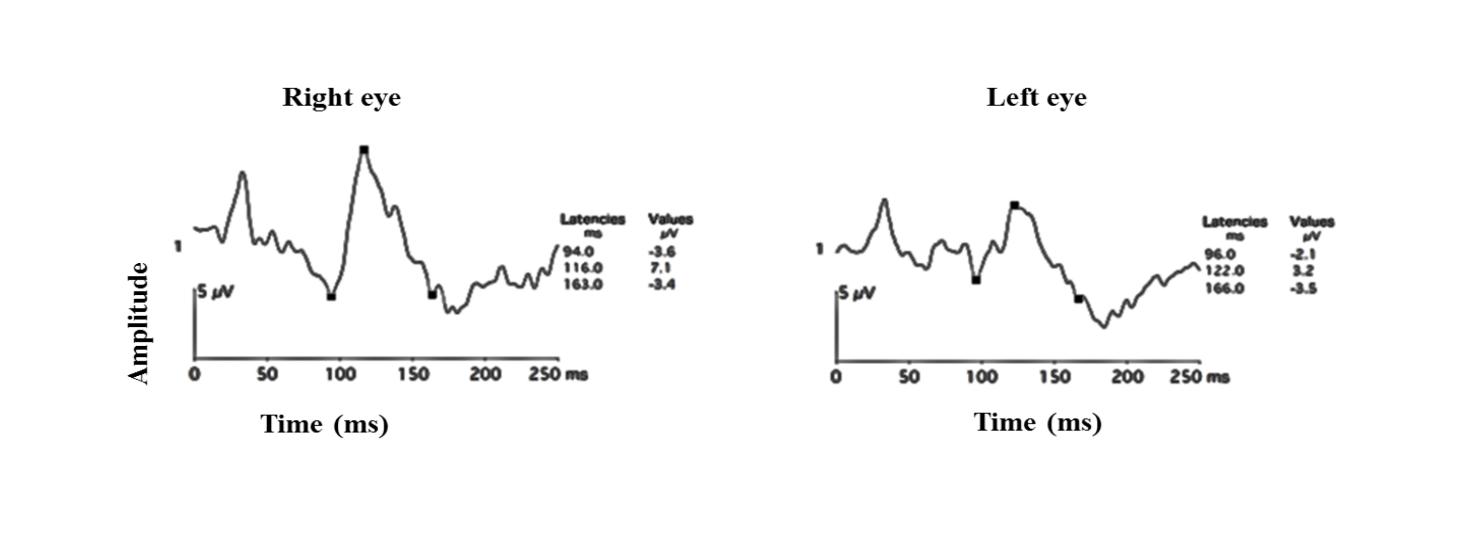
Figure 25 a: Flash VEP showing decrease in amplitudes in the left eye
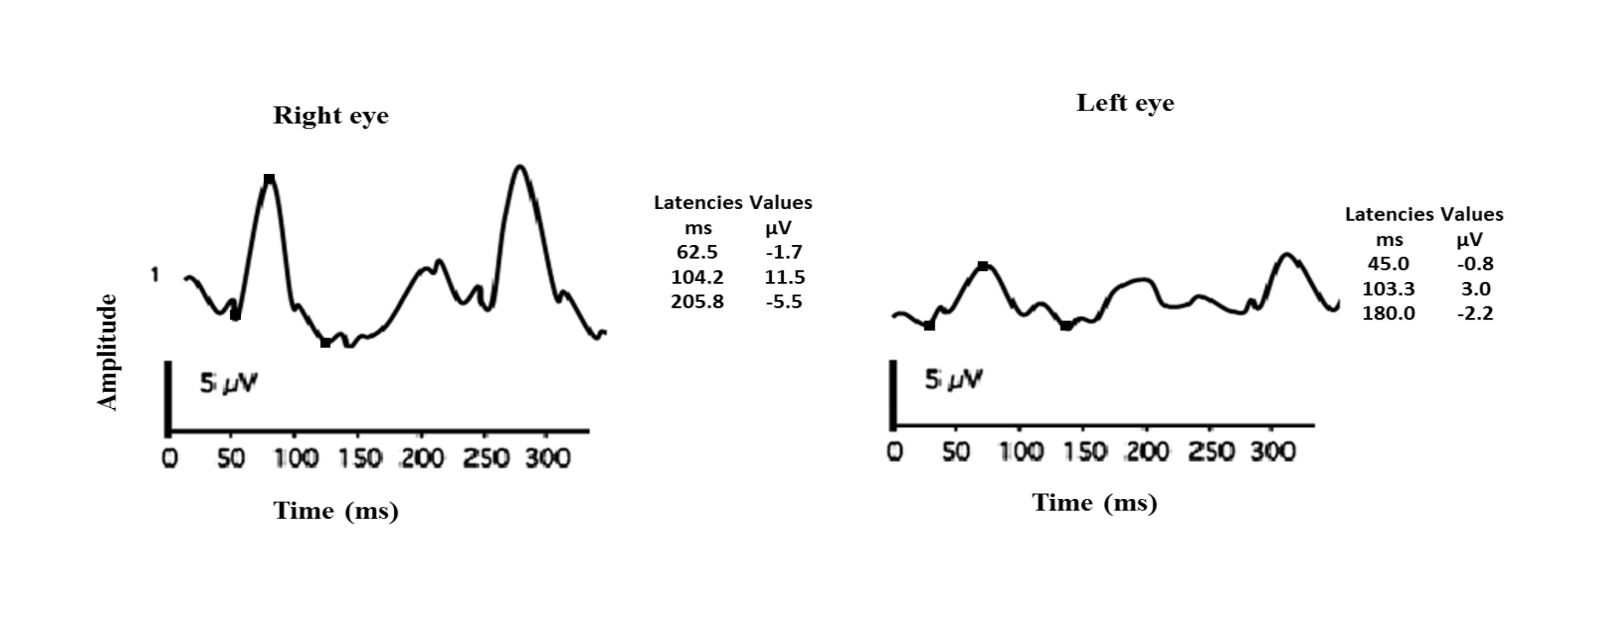
Figure 25 b: PVEP showing a predominant decrease in amplitudes in a subject with ischemic optic neuropathy of the left eye Note that the latency of the P100 remains largely the same.
Flash and pattern VEP responses in compressive optic neuropathy are shown in figure 26 a and b.
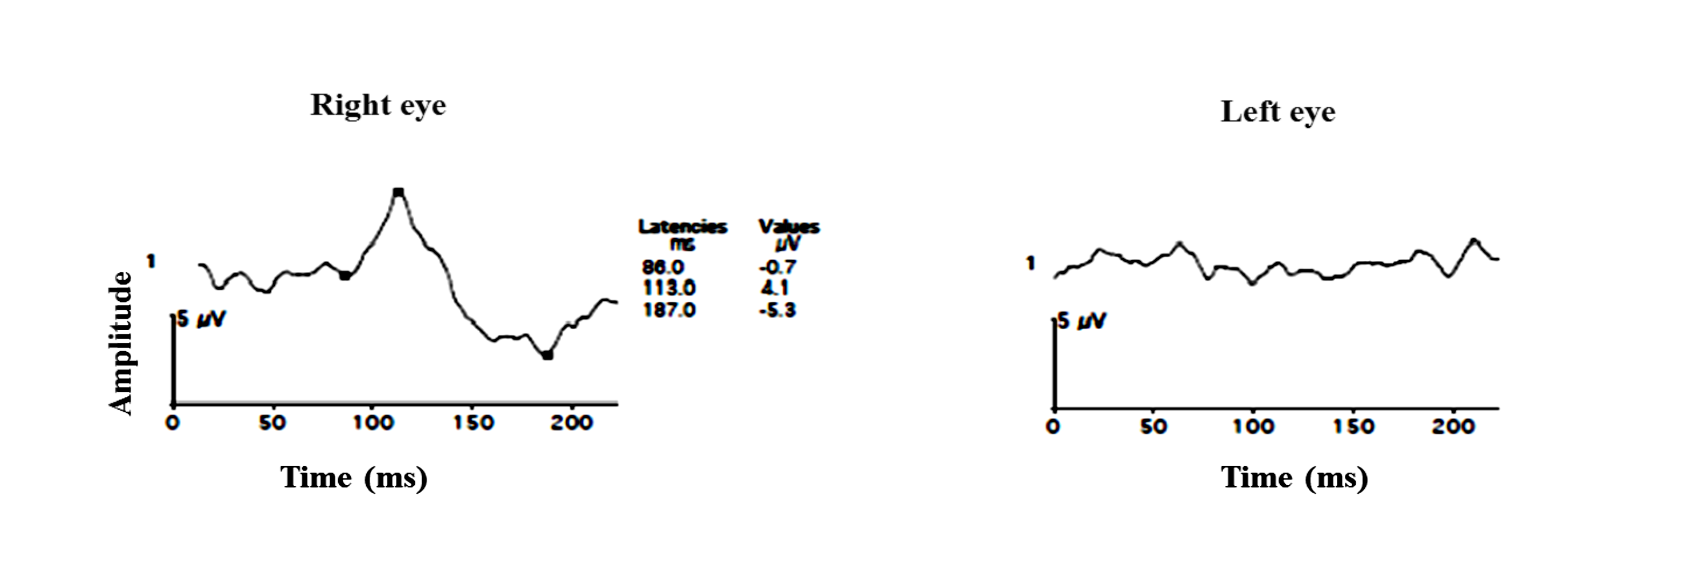
Figure 26 a: Flash VEP in 8 years old female with compressive optic neuropathy due to optic canal narrowing. Right eye vision 2/60 and left eye No Perception of light
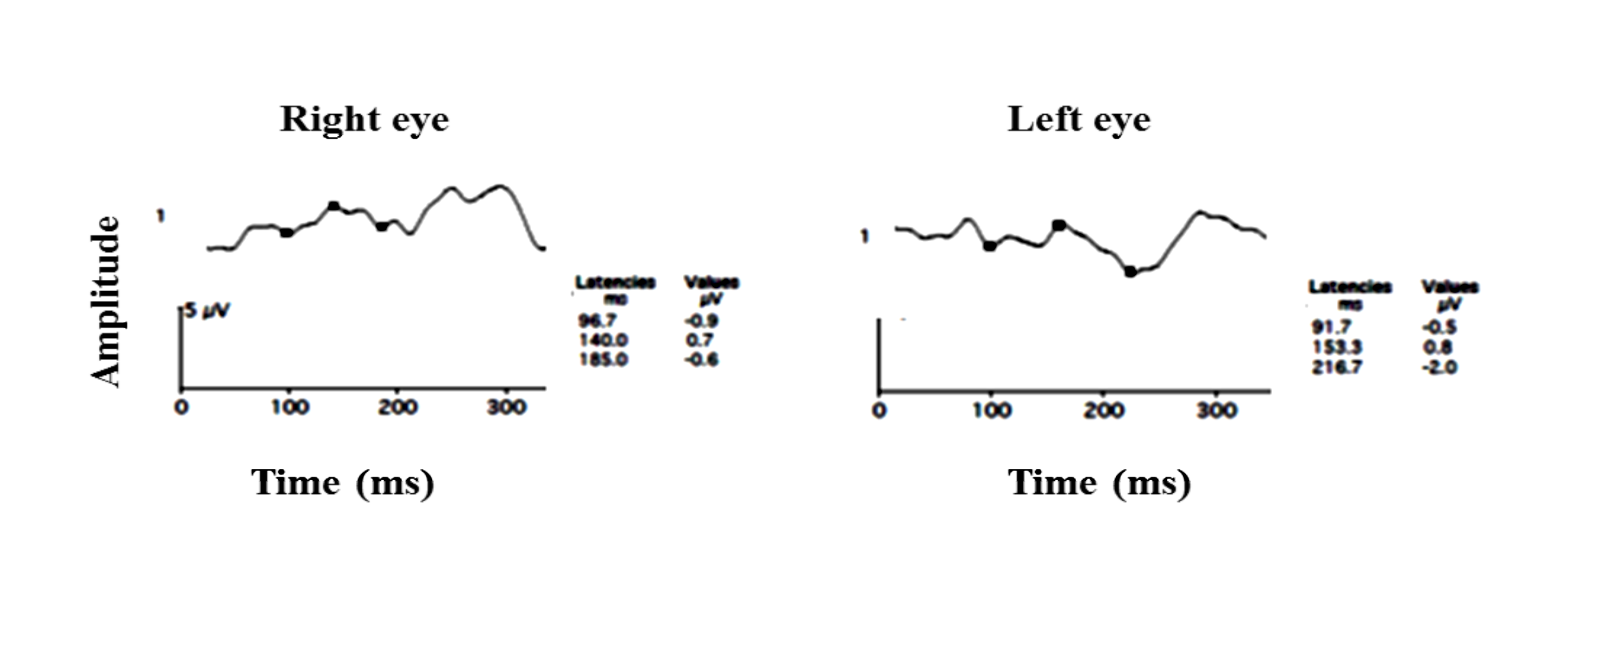
Figure 26 b: Pattern VEP of the same subject. OU reveals a distorted waveform reduced amplitude and delayed P100 latency left eye> right eye
Flash VEP responses in traumatic optic neuropathy are shown in figure 27.
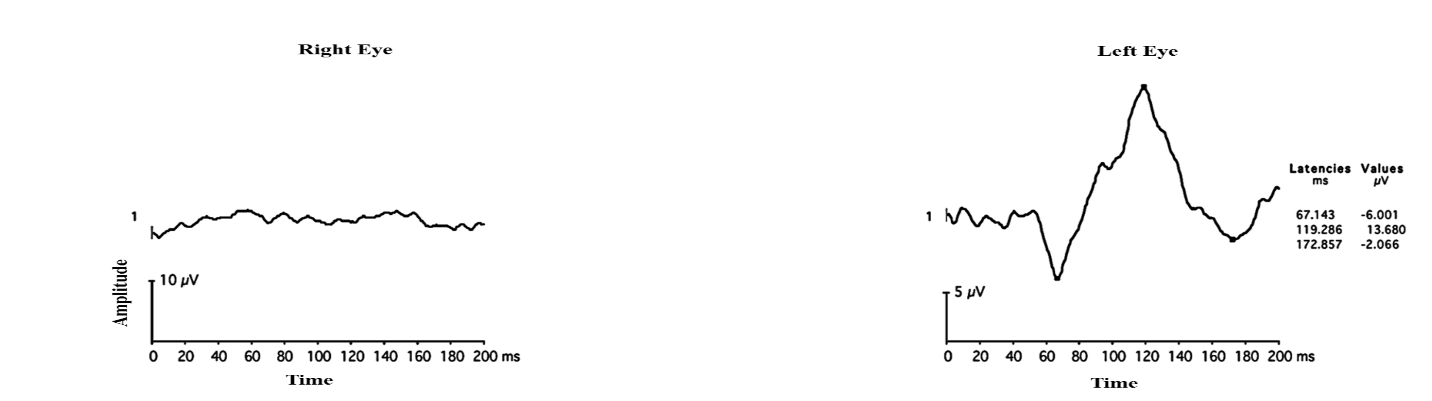
Figure 27: Flash VEP in a 36 years old male who had an injury to the right globe shows a normal waveform in the left eye while the right eye flash VEP is non-recordable
Multifocal VEP
VEP can be recorded from multiple areas in the visual field simultaneously using a multifocal VEP (mfVEP) technique.70 No standards have been set by the ISCEV for mfVEP. Hood et al used mfVEP to objectively measure the visual field function, as subjective tests such as psychophysical visual field testing prone to measurement variability.71,72 Different studies recommend different electrode positions and strategies for analyzing mfVEP waveforms and have clearly stated that mfVEP assessment is dependent on electrodeposition.73,74 mfVEP plays a useful role in identifying local visual field defects but it must be interpreted with caution as it is affected by unsteady fixation errors, media opacities.75
ERG and VEP are one of the best tools in quantifying the functional integrity of visual function. These tests if aptly used can provide useful information about the function of the retinal cells in a wide variety of retinal disorders.
References:
- Dewar J, M Ckendrick JG (1873) On the Physiological Action of Light: No. II. J AnatPhysiol 7:278-282.
- De Rouck A: History of Electroretinogram. Principles and practice of clinical electrophysiology of vision. Ed by Heckenlively JR, Arden GB) MIT press; 2006.
- Granit R, Therman P.O (1937) Excitation and inhibition in the off-effect of the retina. J Physiol. 1937. 26; 91(2): 127–139.
- McCulloch DL, Marmor MF, Brigell MG, Hamilton R, Holder GE, Tzekov R, Bach M (2015) ISCEV Standard for full-field clinical Electroretinography (2015 update). Doc Ophthalmol 130(1):1–12.
- Bush RA, Sieving PA (1994) A proximal retinal component in the primate photopic ERG a-wave. Invest Ophthalmol Vis Sci 35:635-645.
- Birch DG, Anderson JL (1992) Standardized full-field electroretinography. Normal values and their variation with age. Arch Ophthalmol 110(11):1571-1576.
- Dorey CK, Wu G, Ebenstein D, Garsd A, Weiter JJ (1989) Cell loss in the aging retina. Relationship to lipofuscin accumulation and macular degeneration. Invest Ophthalmol Vis Sci 30(8):1691-1699.
- Parvaresh MM, Ghiasian L, GhasemiFalavarjani K, SoltanSanjari M, Sadighi N (2009) Normal values of standard full field electroretinography in an Iranian population. J Ophthalmic Vis Res 4(2):97-101.
- Sachidanandam, R., Ravi, P., & Sen, P. (2017). Effect of axial length on full‐field and multifocal electroretinograms.Clinical and Experimental Optometry.
- Rotenstreich Y, Fishman GA, Anderson RJ, Birch DG (2003) Interocular amplitude differences of the full field electroretinogram in normal subjects. Br J Ophthalmol 87(10):1268-1271.
- Birch DG, Berson EL, Sandberg MA (1984) Diurnal rhythm in the human rod ERG. Invest Ophthalmol Vis Sci 1984; 25:236-238.
- Fuller DG, Knighton RW, Machemer R. Bright-flash electroretinography for the evaluation of eyes with opaque vitreous. Am J Ophthalmol. 1975 Aug;80(2):214-23.
- Heckenlively JR and Arden GB. Principles and practice of Clinical electrophysiology of Vision second edition. Chapter I and III. 123-138.
- MARG E. Development of electro-oculography; standing potential of the eye in registration of eye movement. AMA Arch Ophthalmol. 1951 Feb; 45(2):169-85.
- Arden GB, Barrada A, Kelsey JH: A new clinical test of retinal function based upon the standing potential of the eye. Br J Ophthalmol 1962; 46:449–467
- Armington JC. The electroretinogram. New York: Academic Press; 1974.
- Marmor MF, Mitchell GB, Daphne LM, Carol AW, Michael B (2011) ISCEV standard for clinical electro-oculography (2010 update) Standard for clinical electro-oculography. Doc Ophthalmol 122:1-7.
- Fishman GA, Birch DG, Holder GE, Brigell MG. Electrophysiologic testing in disorders of the retina, optic nerve and visual pathway. Second edition. Ophthalmology monographs. The foundation of the American Academy of Ophthalmology. Chapter II. 157-175.
- Maggon R, Parihar JKS, Vats DPS, Mathur V (2008) Best’s vitelliform Macular dystrophy. Armed Forces Med J India. 64 (4):379-381.
- Grob S, Yonekawa Y, Eliot D (2014) Multimodal imaging of adult-onset foveomacular vitelliform dystrophy. Saudi J Ophthalmol. 28: 104-110.
- Kellner U, Jandeck C, Kraus H, Foerster MH (1998) Autosomal dominant vitreoretinochoroidopathy with normal electrooculogram in a German family. Graefes Arch ClinExpOphthalmol. 236(2):109-114.
- Marmorstein AD,Cross HE,Peachey NS.Prog Retin Eye Res.2009 May;28(3):206-26
- Riggs LA, Johnson EP, Schick AML: Electrical responses of the human eye to moving stimulus patterns. Science 1964;144:567
- Bach M, Brigell MG, Hawlina M, Holder GE, Johnson MA, McCulloch DL, Meigen T, Viswanathan S (2013) ISCEV standard for clinical pattern electroretinography (PERG) – 2012 update. Doc Ophthalmol 126:1–7
- Bach M1, Unsoeld AS, Philippin H, Staubach F, Maier P, Walter HS, Bomer TG, Funk J. Pattern ERG as an early glaucoma indicator in ocular hypertension: a long-term, prospective study. Invest Ophthalmol Vis Sci. 2006 Nov;47(11):4881-7.
- Kondo, M., Miyake, Y., Horiguchi, M., Suzuki, S., &Tanikawa, A. (1995). Clinical evaluation of multifocal electroretinogram. Investigative ophthalmology & visual science, 36(10), 2146-2150.
- Sutter, E. E. (2001). Imaging visual function with the multifocal m-sequence technique. Vision Research, 41, 1241-1255
- Hood, D. C., Bach, M., Brigell, M., Keating, D., Kondo, M., Lyons, J. S., & International Society For Clinical Electrophysiology of Vision. (2012). ISCEV standard for clinical multifocal electroretinography (mfERG)(2011 edition). DocumentaOphthalmologica, 124(1), 1-13.
- Hood DC. Assessing retinal function with the multifocal technique. Progress in Retinal and Eye Research 2000 Sep; 19,(5), 607 – 46. Review
- Marmor MF, Hood DC, Keating D, et al. Guidelines for basic multifocal electroretinography (mfERG). Doc Ophthalmol 2003; 106:105–115
- Shimada Y, Li Y, Bearse MA, Sutter EE et al: Assessment of early retinal changes in diabetes using a new multifocal ERG protocol. Br J Ophthalmol.2001 Apr;(4): 414-9.
- Tzekov RT, Gerth C, and Werner JS: Senescence of human multifocal electroretinogram components: a localized approach. Graefes Arch ClinExpOphthalmol. 2004 Jul; 242(7):549-60. Epub 2004 Apr 15.
- Nabeshima T.: The Effects of Aging on the Multifocal Electroretinogram Jpn J Ophthalmol. 2001 Jan; 45(1):114-115.)
- Luu CD, Lau AM, Lee SY: Multifocal electroretinogram in adults and children with myopia. Arch Ophthalmol. 2006 Mar; 124(3): 328-34.
- Nagy, D., Schönfisch, B., Zrenner, E., &Jägle, H. (2008). Long-term follow-up of retinitis pigmentosa patients with multifocal electroretinography. Investigative ophthalmology & visual science, 49(10), 4664-4671)
- Sen P, Roy R, Maru S, Ravi P . Evaluation of focal retinal function using multifocal electroretinography in patients with X-linked retinoschisis.Can J Ophthalmol. 2010 Oct;45(5):509-13.
- Maia-Lopes S, Silva ED, Silva MF, Reis A, Faria P, Castelo-Branco M.Invest Ophthalmol Vis Sci.2008 Mar;49(3):1191-9.
- Glybina, I. V., & Frank, R. N. (2006). Localization of multifocal electroretinogram abnormalities to the lesion site: findings in a family with Best disease. Archives of ophthalmology, 124(11), 1593-1600.
- Suzuki K, Hasegawa S, Usui T, et al .Multifocal electroretinogram in patients with central serous chorioretinopathy. Jpn J Ophthalmol. 2002 May-Jun; 46(3):308-14.
- MoschosMN, MoschosMM, Apostolopoulos M, et al: Assessing hydroxychloroquine toxicity by the multifocal ERG Doc Ophthalmol. 2004 Jan;108(1):47-53).
- Maturi RK, Yu M, Weleber RG: Multifocal electroretinographic evaluation of long-term hydroxychloroquine users. Arch Ophthalmol. 2004 Jul;122(7):973-81.
- Marmor F,Kellner U,Lai TY,Melles RB,Mieler WF;American Academy of Ophthalmology.Recommendations on screening for chloroquine and hydroxychloroquine retinopathy (2016 Revision. Ophthalmology 2016;123(6):1386-1394.
- S. Viswanathan, L. J. Frishman, J. G. Robson, R. S. Harwerth, and E. L. Smith III, “The photopic negative response of the macaque electroretinogram: reduction by experimental glaucoma,” Inv e s t i g a t i v e O p h t h a l m ol o g y & Vi s u a l Scienc e, vol. 40, no. 6, pp. 1124–1136, 1999
- Shen, X., Huang, L., Fan, N., & He, J. (2013). Relationship among photopic negative response, retinal nerve fiber layer thickness, and visual field between normal and POAG eyes. ISRN ophthalmology, 2013.
- Rangaswamy, N. V., Frishman, L. J., Dorotheo, E. U., Schiffman, J. S., Bahrani, H. M., & Tang, R. A. (2004). Photopic ERGs in patients with optic neuropathies: comparison with primate ERGs after pharmacologic blockade of inner retina.Investigative ophthalmology & visual science,45(10), 3827-3837.
- Tang, J., Edwards, T., Crowston, J. G., &Sarossy, M. (2014). The Test–Retest Reliability of the Photopic Negative Response (PhNR). Translational vision science & technology, 3(6), 1-1.
- Machida, S., Gotoh, Y., Toba, Y., Ohtaki, A., Kaneko, M., &Kurosaka, D. (2008). Correlation between photopic negative response and retinal nerve fiber layer thickness and optic disc topography in glaucomatous eyes. Investigative ophthalmology & visual science, 49(5), 2201-2207.
- Kaneko, M., Machida, S., Hoshi, Y., &Kurosaka, D. (2015). Alterations of photopic negative response of multifocal electroretinogram in patients with glaucoma. Current eye research, 40(1), 77-86.
- N. Drasdo, Y. H. Aldebasi, Z. Chiti, K. E. Mortlock, J. E. Morgan, and R. V. North, “The s-cone PhNR and pattern ERG in primary open angle glaucoma,” Investigative Ophthalmology & Visual Science, vol. 42, no. 6, pp. 1266–1272, 2001.
- S. Machida, K. Tamada, T. Oikawa et al., “Comparison of photopic negative response of full-field and focal elecoretinograms in detecting glaucomatous eyes,” Journal of Ophthalmology.
- Han, Y., Bearse, M. A., Schneck, M. E., Barez, S., Jacobsen, C. H., & Adams, A. J. (2004). Multifocal electroretinogram delays predict sites of subsequent diabetic retinopathy. Investigative ophthalmology & visual science, 45(3), 948-954.
- Fortune, B., Schneck, M. E., & Adams, A. J. (1999). Multifocal electroretinogram delays reveal local retinal dysfunction in early diabetic retinopathy. Investigative ophthalmology & visual science, 40(11), 2638-2651.
- Palmowski, A. M., Sutter, E. E., Bearse, M. A., & Fung, W. (1997). Mapping of retinal function in diabetic retinopathy using the multifocal electroretinogram. Investigative ophthalmology & visual science, 38(12), 2586-2596.
- Kim, H. D., Park, J. Y., &Ohn, Y. H. (2010). Clinical applications of photopic negative response (PhNR) for the treatment of glaucoma and diabetic retinopathy. Korean Journal of Ophthalmology, 24(2), 89-95.
- Chen, H., Zhang, M., Huang, S., & Wu, D. (2008). The photopic negative response of flash ERG in nonproliferative diabetic retinopathy. DocumentaOphthalmologica, 117(2), 129-135.
- McFarlane, M., Wright, T., Stephens, D., Nilsson, J., &Westall, C. A. (2012). Blue flash ERG PhNR changes associated with poor long-term glycemic control in adolescents with type 1 diabetes. Investigative ophthalmology & visual science, 53(2), 741-748.
- Machida, S., Gotoh, Y., Tanaka, M., &Tazawa, Y. (2004). Predominant loss of the photopic negative response in central retinal artery occlusion.American journal of ophthalmology,137(5), 938-940.
- Chen, H., Wu, D., Huang, S., & Yan, H. (2006). The photopic negative response of the flash electroretinogram in retinal vein occlusion.Documenta ophthalmologica,113(1), 53-59.
- Odom JV, Bach M, Brigell M, Holder GE, McCulloch DL, Mizota A, Tormene AP, International Society for Clinical Electrophysiology of Vision. ISCEV standard for clinical visual evoked potentials :( 2016 update). DocumentaOphthalmologica. 2016 Aug 1; 133(1):1-9.
- Walsh P, Kane N, Butler S. The clinical role of evoked potentials. Journal of neurology, neurosurgery & psychiatry. 2005 Jun 1; 76(2):ii16-22.
- Horton JC, Hoyt WF. The representation of the visual field in human striate cortex: a revision of the classic Holmes map. Archives of ophthalmology. 1991 Jun 1; 109(6):816-24.
- Heckenlively JR, Arden GB. Principles and practice of clinical electrophysiology of vision. MIT press; 2006.
- Jeffreys DA: Separable components of human evoked responses to spatially patterned visual fields. EEG ClinNeuro- physiol 1968; 24:596.
- Spekreijse H, van der Tweel LH, Zuidema TH: The contrast evoked responses in man. Vision Res 1973; 13:1577–1601.
- Klem GH, Lüders HO, Jasper HH, Elger C. The ten-twenty electrode system of the International Federation. ElectroencephalogrClinNeurophysiol. 1999; 52(3):3-6.
- Cobb WA, Morton HB, Ettlinger G. Cerebral potentials evoked by pattern reversal and their suppression in visual rivalry. Nature. 1967.
- Dustman RE, Beck EC. The effects of maturation and aging on the wave form of visually evoked potentials. Electroencephalography and clinical neurophysiology. 1969 Jan 1;26(1):2-11.
- Harding GF, Bland JD, Smith VH. Visual evoked potential monitoring of optic nerve function during surgery. Journal of Neurology, Neurosurgery & Psychiatry. 1990 Oct 1; 53(10):890-5.
- Thornton C, Sharpe RM. Evoked responses in anaesthesia. British journal of anaesthesia. 1998 Nov 1; 81:771-81.
- Baseler HA, Sutter EE, Klein SA, Carney T. The topography of visual evoked response properties across the visual field. Electroencephalography and clinical neurophysiology. 1994 Jan 31;90(1):65-81.
- Hood DC. Objective measurement of visual function in glaucoma. Current opinion in ophthalmology. 2003 Apr 1;14(2):78-82.
- Hood DC, Greenstein VC. Multifocal VEP and ganglion cell damage: applications and limitations for the study of glaucoma. Progress in retinal and eye research. 2003 Mar 31;22(2):201-51.
- Kikuchi Y, Yoshii M, Yanashima K, Enoki T, Ide T, Sakemi F, Okisaka S. Multifocal visual evoked potential is dependent on electrode position. Japanese journal of ophthalmology. 2002 Oct 31;46(5):533-9.
- Meigen T, Krämer M. Optimizing electrode positions and analysis strategies for multifocal VEP recordings by ROC analysis. Vision research. 2007 May 31;47(11):1445-54.
- Winn BJ, Shin E, Odel JG, Greenstein VC, Hood DC. Interpreting the multifocal visual evoked potential: the effects of refractive errors, cataracts, and fixation errors. British journal of ophthalmology. 2005 Mar 1;89(3):340-4.