

Introduction
Optical Coherence Tomography is a powerful noninvasive imaging modality that performs high resolution, micron-scale, cross-sectional imaging of the retina. Originally developed in 1991 by Huang et al, [1] OCT technology has continually evolved and expanded within ophthalmologyand has been explored in a wide range of clinical applications. With the introduction of Spectral/ Fourier Domain OCT (SD-OCT, FD-OCT) and Swept Source OCT (SS-OCT), there is greater tissue resolving power, significantly higher scan density, and faster data acquisition than original Time Domain OCT. Thus, OCT has revolutionized the practice of ophthalmology and, in particular the diagnosis and management of patients with retinal disease. This chapter describes the basics of OCT technology and its clinical applications in retinal disorders.
OCT technology and working principle [2-8]
OCTs operate on the principle of indirect low-coherence interferometry, in which a beam of light is directed into the retina, and the resulting back-scattered light travels an unknown distance to a detector, which is compared to a reference beam of a known length to calculate the echo time delay of light. TD- OCT employs near-infrared light for better penetration of ocular structures. When the distance between the light source and retinal tissue equals the distance between the light source and reference mirror, the reflected light and the reference mirror interacts to produce an interference pattern. The interference measured by the photodetector is then converted to an A-scan signal.
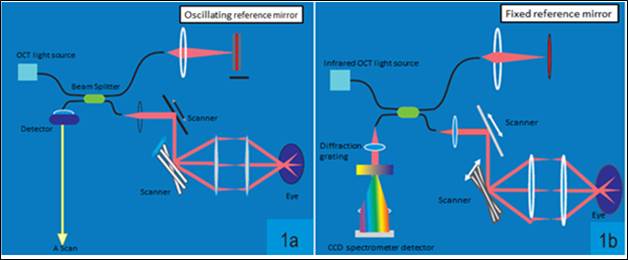
Fig 1a. Schematic representation of the working principle of TD- OCT. Here the beam splitter directs the 830 nm beam into the reference mirror and the area to be scanned. The photodetector receives the interference signal. Here the position of the reference mirror is kept constantly changing which limits the speed of scanning. Fig 1b. In SD-OCT, the reference mirror is kept stationary. The spectral pattern of the interference between the sample and reference reflections is measured using a spectrometer.
To date we have crossed three milestones in the development of OCT technology. Table 1 enlists the major differences between each of them. Swept Source- OCT (SS-OCT) which is the latest in this regard uses longer wavelength (1050 nm) to overcome scattering by the RPE and employs photodetectorsinstead of earlier CCD cameras to further increase the resolution. With faster scan acquisition rates using SD-OCT and SS-OCT, the diagnostic accuracy has been enhanced by eliminating the use of alignment algorithms to correct patient movement in "lengthy” TD scans. As a result, significant motion artifacts are avoided and multiple measurements can be taken in a short time enabling the three-dimensional retinal scanning.

Table 1. Comparing features of various OCT systems.
Scan protocols
Different scanning protocols can be used in the OCT machine for retinal examination. The choice of the protocol should depend on the area of interest and the concerned pathology. Important scan protocols are described below.
Macular Cube (Fig 2a)
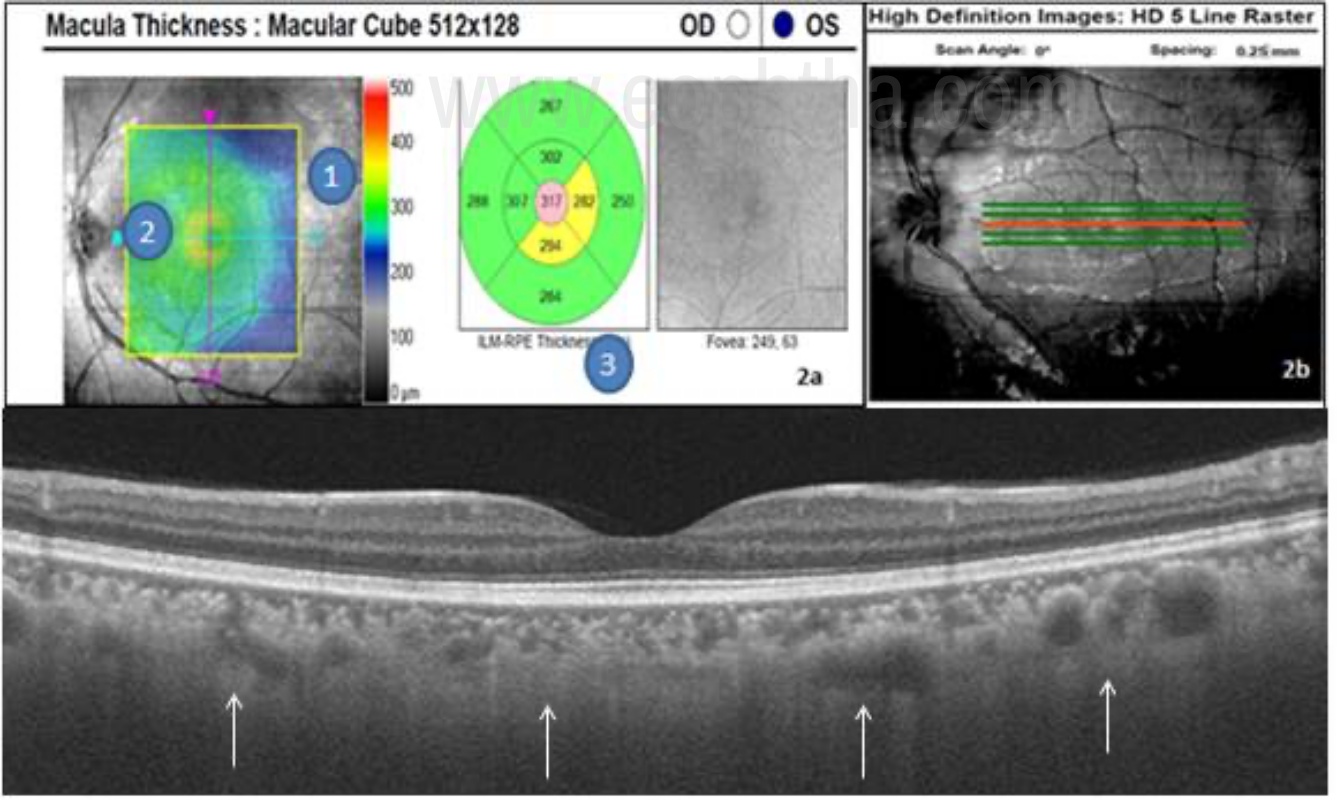
Fig 2a. - Macular cube OCT report. 1- Fundus image with an ILM-RPE retinal thickness map overlay. 2. Slice navigator- Enables to scan at the desired location. 3. ETDRS grid – Gives retinal thickness values from ILM to RPE in microns. 2b- 5 line raster shown (Redline in the middle denoting the level of the scan.) Fig 2c- EDI OCT delineating the choroidal layers better.
Macular cube protocol consists of either 200 x 200 scans or 128 x 512 scans where the first number denotes the number of horizontal scan lines and the second numeral denotes the number of A-scans per horizontal scan line, over the 6mm square grid. It provides quantitative information about the thickness of the retina in a color-coded map. Warm colors (red, yellow, white) indicate areas of the thicker retina and cold colors (green, blue) indicate areas of the thinner retina. The data provided by serial thickness maps are useful for monitoring progress and response to treatment over time, particularly in macular edema.
5 line raster (Fig 2b)
The 5-line raster scan gives the highest density scan. It consists of 4,096 A-scans in each of the five lines. The length, angle and spacing between the lines can be adjusted to acquire the best view of the area of interest. The 5 line scan with 3mm length provides OCT image with maximum resolution. The position of the scan can be changed to image areas of focal pathology outside of the fovea. This type of scan is good for making a diagnosis and assessing the retinal layers in detail.
Enhanced Depth imaging- EDI ( Fig 2c)
In SD-OCT, the outer limit of the choroid and the sclera cannot be reliably identified due to the scattering of light from pigmented RPE. In SD-OCT depth information is coded as different frequencies of the interference spectrum. With increasing depth into the tissue, echoes occur further from the point of detection, which is known to be the “Zero delay line”. Retinal structures closer to the zero-delay line will have brighter signals than that are farther. In conventional OCT machines the inner retina is close to the zero-delay line to maximize the sensitivity from the retina and vitreoretinal interface. Moving the joystick towards the eye moves the zero delay line to the posterior part of the retina and provides a clearer image of the choroid, but inverted. EDI software automatically captures the cross-sectional image of the choroid close to the zero-delay line to maximize the sensitivity on the outer limit of the choroid as shown in fig 2c. [9- 11]
Color-coded versus grayscale images
OCT technology identifies changes in optical density and illustrates them in either color-coded or grayscale format. When two adjacent structures differ in their refractive index, a greater volume of light is reflected at their interface. Large reflections are depicted by warm colors (red through yellow) and mild reflections are depicted by cool colors (green through blue). [Table 2] An absence of reflection appears black. Images in grayscale utilize brighter shading in lieu of warmer colors.
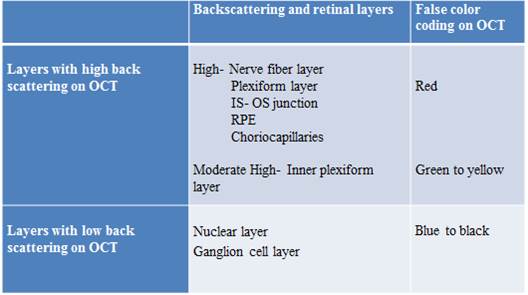
Table 2- Retinal layers according to the degree of backscattering and respective color coding in OCT.
Grayscale images are better than color images for visualizing epiretinal membranes (ERM), photoreceptor (PR), and retinal pigment epithelium (RPE) morphology. Color images can be misleading as the displayed colors are false colors and dramatic changes in color can be misinterpreted as large changes in OCT reflectivity.
Layer wise interpretation of OCT (Fig. 3)
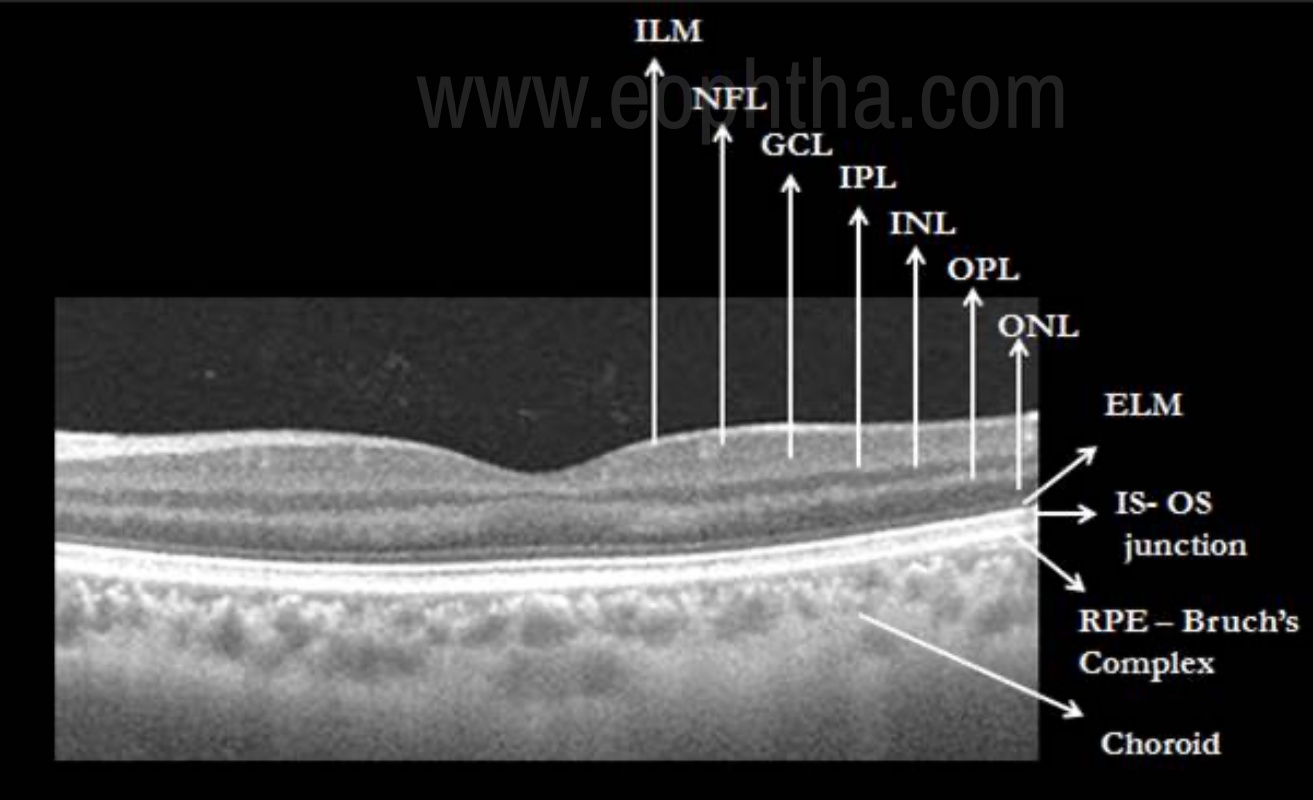
Figure 3- SS-OCT illustration of the various layers of retina and choroid. Retinal layers from inside out are ILM- Internal limiting membrane, NFL- Nerve fiber layer, GCL- ganglion cell layer, IPL- inner plexiform layer, INL- inner nuclear layer, OPL- outer plexiform layer, ONL- outer nuclear layer, ELM- External limiting membrane, IS-OS junction- Inner segment- outer segment junction and RPE- Bruch’s Complex.
Cross-sectional imaging of retinal pathology with the high definition OCT technology has enabled us to visualize the retina in distinct layers. Subtle disruptions in the various layers can be recognized with much high precision than with earlier TD- scans. OCT can be analyzed in 5 different layers as -
a. Pre-retina
Pre-retina is comprised of the vitreous anterior to the retina is seen as a non-reflective dark space in OCT. Faint dots in the pre-retinal space indicate “noise” which is formed due to the electronic aberration created by increasing sensitivity of the instrument to better visualize low reflective structures.
b. Vitreoretinal interface
The vitreoretinal interface is well defined due to the contrast between non-reflective vitreous and the backscattering retina.
c. Retina
As shown in figure 3, the anterior boundary of the retina is formed by the internal limiting membrane (ILM), which is seen as a hyperreflective layer. Posterior boundary, which is also hyper- reflective, represents the highly refractive retinal pigment epithelium and choriocaplillaries. Different intermediate layers of the neurosensory retina between the nerve fiber layer and RPE can be seen with characteristic reflectivity patterns as shown in figure 3. Outer retina is characterized by the presence of four distinct hyperreflective lines. They are external limiting membrane (ELM), inner segment – outer segment junction (IS-OS), and RPE-choriocapillary layer.
d. Choroid
SS-OCT and EDI- OCT have enabled us to image choroid which is seen as multiple layers going from the innermost Bruch membrane to the choriocapillaris, Sattler layer (layer of medium diameter blood vessels), Haller layer (outermost layer of the choroid consisting of larger diameter blood vessels) and a hyperreflective line indicating the choroido-scleral junction (CSJ). [12, 13]
Revised OCT nomenclature (Fig 4)
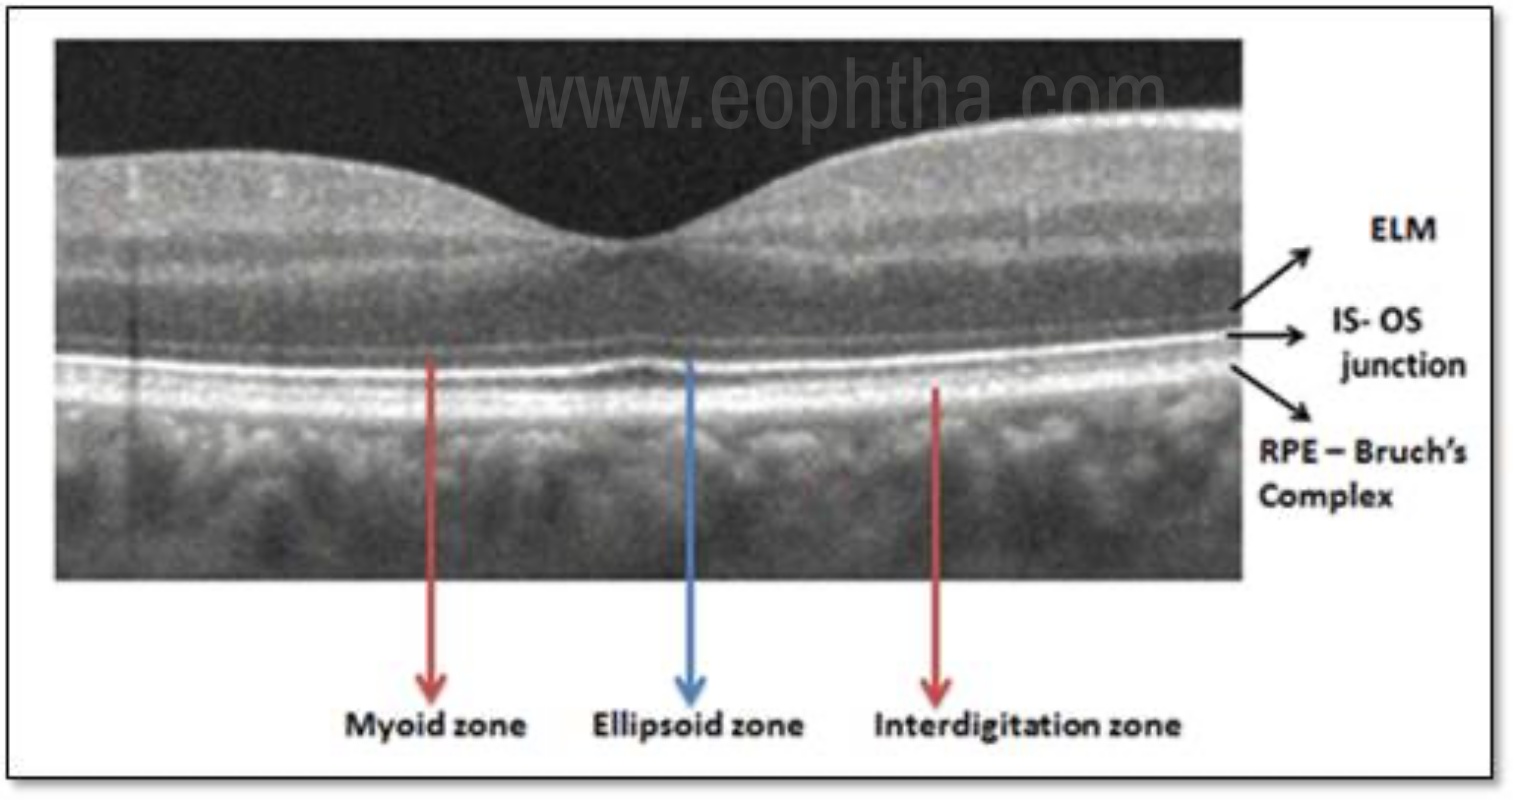
Figure 4. Showing the zones in the outer retina as per the International Nomenclature for Optical Coherence Tomography Panel.
International Nomenclature for Optical Coherence Tomography panel has proposed and adopted a standardized nomenclature for the classification of retinal and choroidal layers and bands visible on SD- OCT. [17] The term “zone” was introduced by the authors to define regions without recognized histopathological correlation to a specific retinal layer or the anatomic layers are inseparable owing to interdigitation of cellular structures and tissues (e.g., RPE/Bruch’s complex). The recent nomenclature of the outer retinal bands and their anatomic feature attributions are described below, from the innermost to the outermost.
- Ellipsoid zoneThis hyperreflective band which was previously referred as the photoreceptor inner segment/outer segment (IS/OS) junction, is now thought to be formed mainly by mitochondria within the ellipsoid layer of the outer portion of the inner segments of the photoreceptors. In a normal fovea, the distance from the EZ line to the ELM is shorter than that from the EZ line to the RPE.
- Myoid zoneThe hyporeflective region between ELM and ellipsoid zone is described as the myoid zone. The reduced reflectivity of this zone is attributed to the lower packing density of mitochondria in the myoid as opposed to the ellipsoid region of the photoreceptor.
- Interdigitation zone The interdigitation zone (IZ) previously referred to as cone outer segment tips (COST) or rod outer segment tips (ROST), corresponds to apices of the RPE cells that encase part of the cone outer segments. The differentiation of this layer from the underlying RPE layer is very difficult even in normal eyes.
- RPE- Bruch’s complex The outermost band in the retina previously described as the RPE has now been realized to be formed of 2 hyperreflective bands separated by a hyporeflective layer. These 2 hyperreflective bands correspond with the RPE and Bruch’s membrane which are often not separable under normal conditions. Therefore the term RPE – Bruch’s complex was proposed.
Comparison of available OCT systems
The various OCT systems currently in use are Stratus® OCT, Cirrus® SD-OCT (both from Carl Zeiss Meditec, Dublin, CA) and Spectralis® (Heidelberg Engineering, Heidelberg, Germany) OCT. The variations among them in defining macular thickness values are due to the discrepancies in the retinal segmentation algorithms. While Stratus® OCT measures the thickness of the retina as the distance between the inner limiting membrane (ILM) and the junction of the outer segment and inner segment of the photoreceptors, Cirrus® SD-OCT reports it as the distance from the anterior border of the retinal pigment epithelium to the ILM and Spectralis® OCT measures the distance from the posterior border of the RPE to the ILM. So for a given patient, the thickness will be maximum with Spectralis® OCT and the least will be reported by Stratus® OCT. [18, 19]
Clinical applications of OCT
Optical coherence tomography provides both qualitative (morphology and reflectivity) and quantitative (thickness, mapping, and volume) analyses of the examined tissues in-situ. Qualitative data can be in the form of identification of retinal pathologies like vitreomacular traction, macular holes, cystoid macular edema, and choroidal neovascular membrane.[20] Quantitative data such as foveal thickness are used to make treatment decisions like in conditions such as age-related macular degeneration, diabetic macular edema, and retinal vein occlusions.). It is indicated in various retinal disorders; however it should not be interpreted independently in reference to any ocular disease. [21, 22] Clinical applications of OCT include
- Clinical aid in diagnosis and prognostication
- To plan treatment
- Monitor response to treatment
For the ease of understanding the further discussion on OCT interpretation will be focused on abnormalities in the layers starting from inner to outer.
Posterior vitreous face (Fig 5)
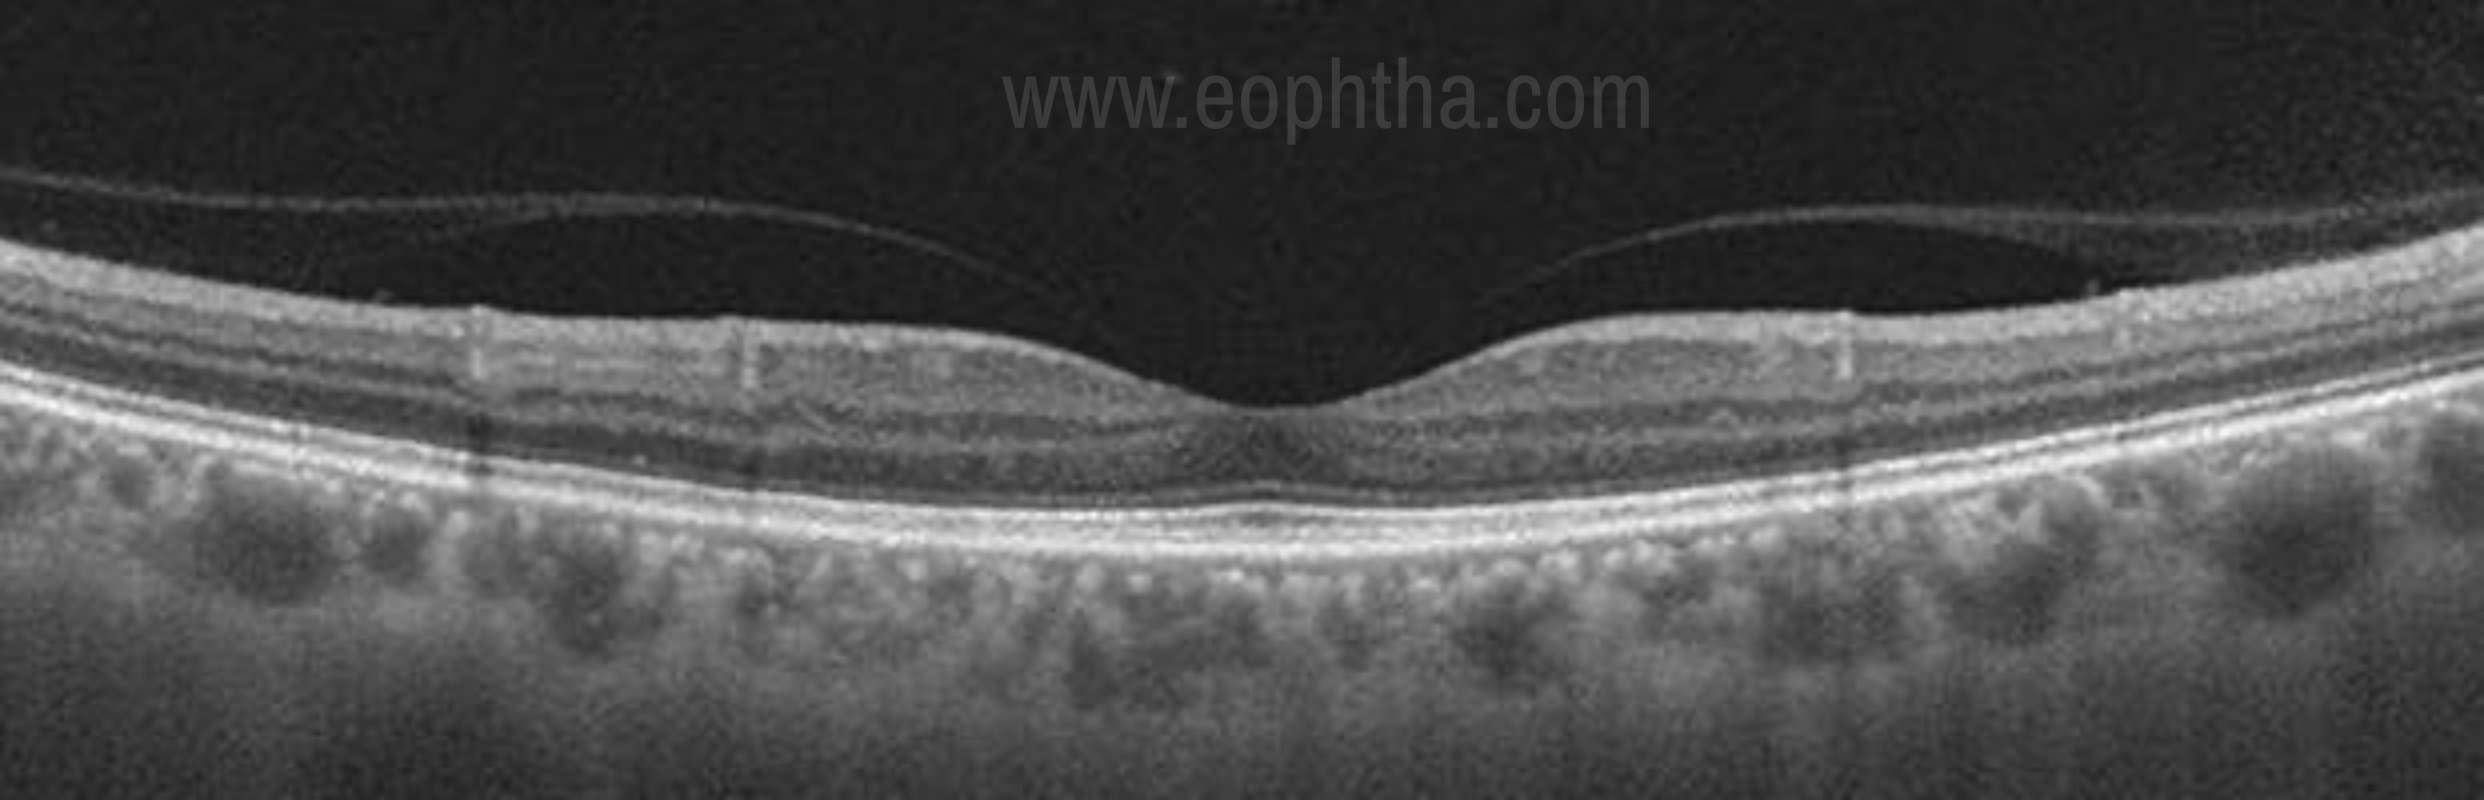
Figure 5. Posterior vitreous detachment- The posterior hyaloid membrane has detached partially but still firmly attached to the macula.
The condensed vitreous overlying the ILM is called the posterior vitreous face. The separation of this layer from the retina known as posterior vitreous detachment or PVD and is of great clinical significance in the treatment of many vitreoretinal diseases. Although a normal physical phenomenon related to aging, certain risk factors like high myopia, intraocular inflammation (uveitis), trauma, and previous eye surgery can predispose to the development of anomalous PVD. [23- 26]
PVD occurs as a result of central vitreous syneresis (liquefaction).With increasing age, an opening ultimately develops in the posterior vitreous through which the central liquefied vitreous passes suddenly into the retrovitreal space, dissecting a plane and separating the posterior hyaloid from the retina as shown in figure 5. Thus the posterior vitreous detaches from the retina and collapses anteriorly toward the vitreous base. As the PVD progresses and becomes complete it moves too anteriorly to be imaged in a single frame with the retina.
Vitreo-macular interface
In young, vitreous is normally found attached to the optic disc, blood vessels, internal limiting membrane (ILM) of the retina, and vitreous base. The posterior vitreous cortex and retinal ILM are bound at their interface by fibronectin, laminin, and other extracellular components that form a glue-like matrix. [27-29] The international Vitreomacular traction study group [27] has described the characteristics of normal as well as pathological interaction at the vitreoretinal interface at the macula. They have defined vitreomacular adhesion (VMA) as an elevation of the cortical vitreous above the retinal surface, with the vitreous remaining attached within a 3-mm radius of the fovea. Here the retina displays no change in contour or morphologic features on OCT because of the vitreous adhesion. The progression of PVD can lead to periods of excessive traction on the macula. Such traction can result in anatomic changes in the contour of the foveal surface, intraretinal pseudocyst formation, elevation of the fovea from the RPE, or a combination that typically results in reduced or distorted vision. [30] At a stage when VMA progresses to involve structural changes in the retina, the eye is characterized as having VMT as is shown in figure 6.
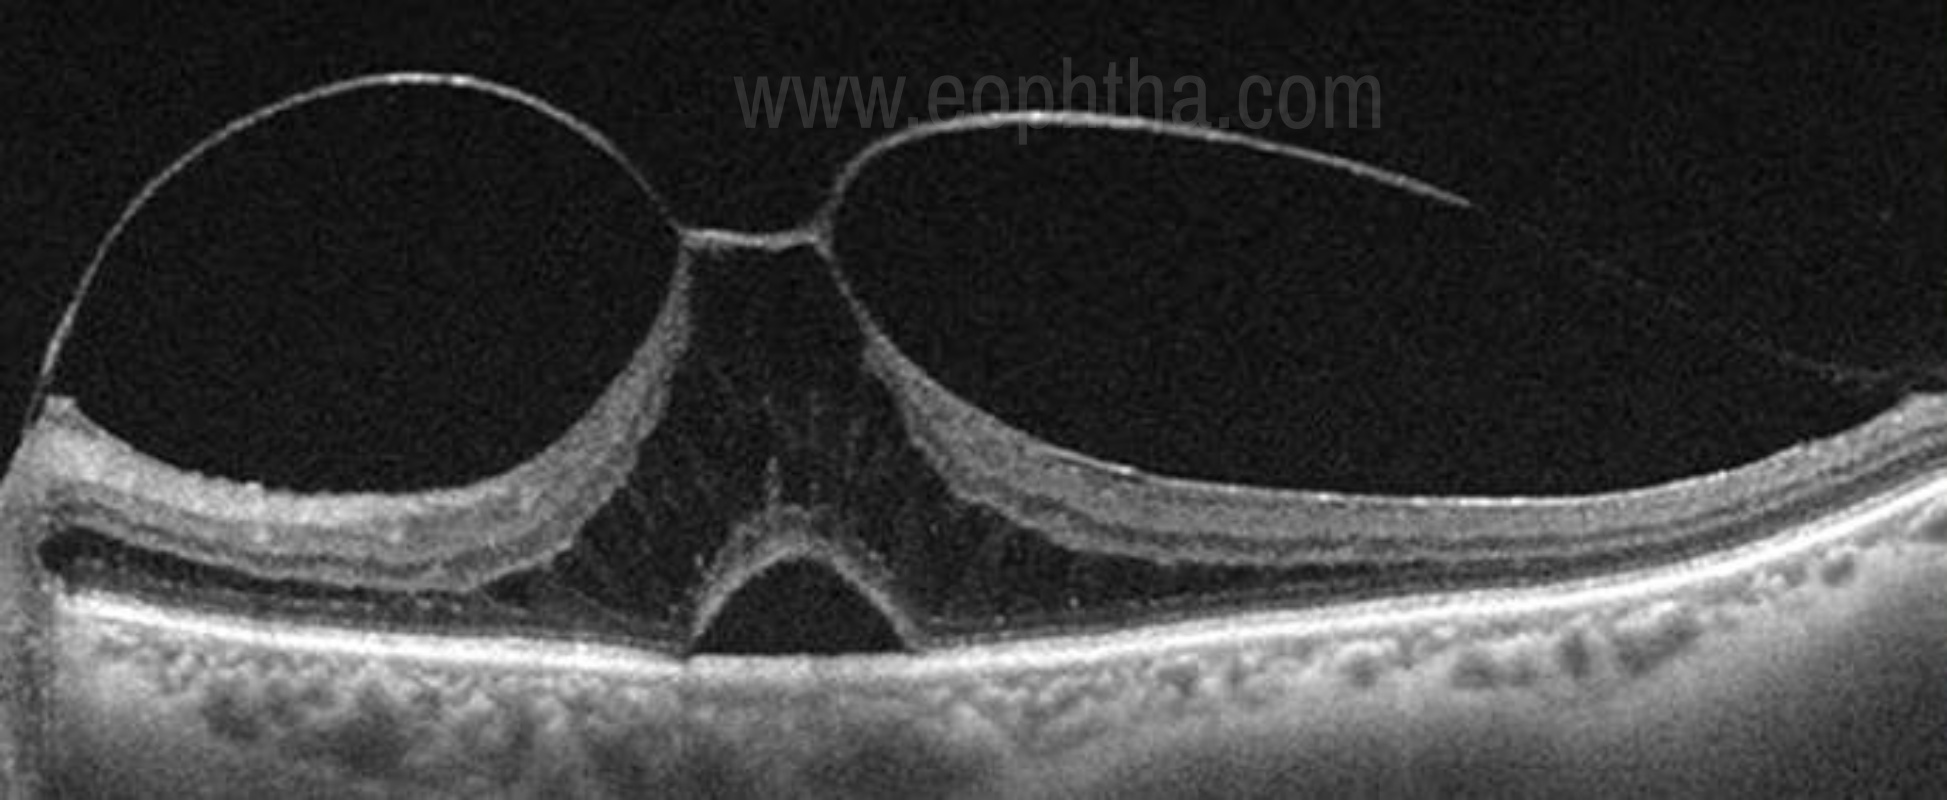
Figure 6. Vitreomacular traction- VMA has progressed to involve structural changes in the retina. Here the eye is characterized as having VMT.
Epiretinal
The anterior surface of the retina is called as epiretina. Epiretinal membrane (ERM) can result from idiopathic causes or may be secondary to retinal trauma, inflammation, or proliferative retinal disorders. It is seen as a distinct moderate to a high reflective line in close contact with the retinal surface. [31, 32] ERM can be globally attached to the ILM or may have interrupted focal attachments. They can cause wrinkling of the inner retinal surface, which in OCT is seen as irregular saw-tooth shaped undulations in the surface due to traction on the retina. The closest differential would be a detached posterior hyaloid face which also appears as a reflective band anterior to the retina. The reflectivity of the posterior hyaloid in comparison to ERM is thin and weak. OCT prognosticates the condition more accurately by detecting any underlying alteration in the retinal architecture when surgical treatment is planned. (Fig 7)
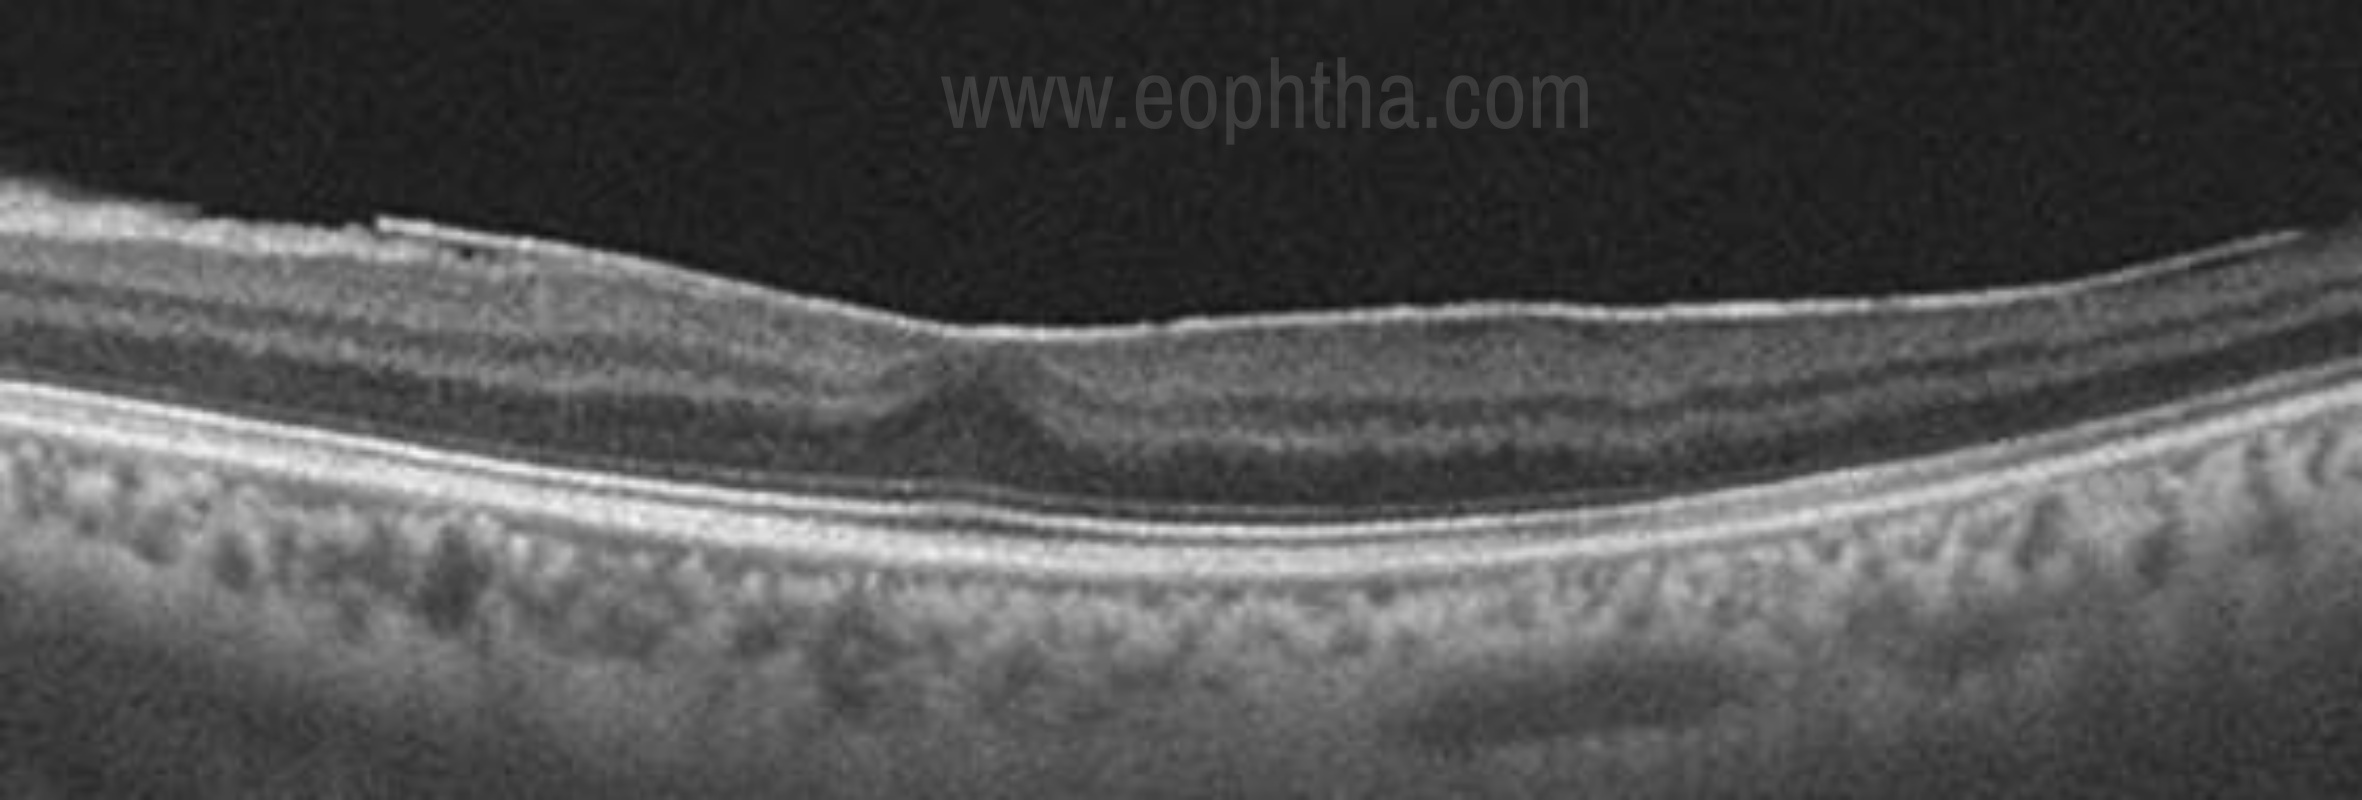
Fig 7. Epiretinal membrane- Hyper- reflective ERM which is globally attached to the inner retinal surface.
Retina (Inner and outer)
The fovea is formed of only 4 retinal layers- the internal limiting membrane, outer plexiform layer, outer nuclear layer, and photoreceptor layer. OCT findings in several common retinal disorders are described below.
Macular pseudohole (Fig 8)
Pseudohole is considered as a precursor stage of true macular hole wherein there is no architectural disturbance in the retinal layers. It is usually seen in association with an epiretinal membrane. OCT helps to differentiate pseudomacular hole from true macular hole which is difficult clinically. Key diagnostic features on OCT include steep foveal contour with no loss of retinal layers and a moderate reflective thickened band of ERM on the retinal surface. [33]
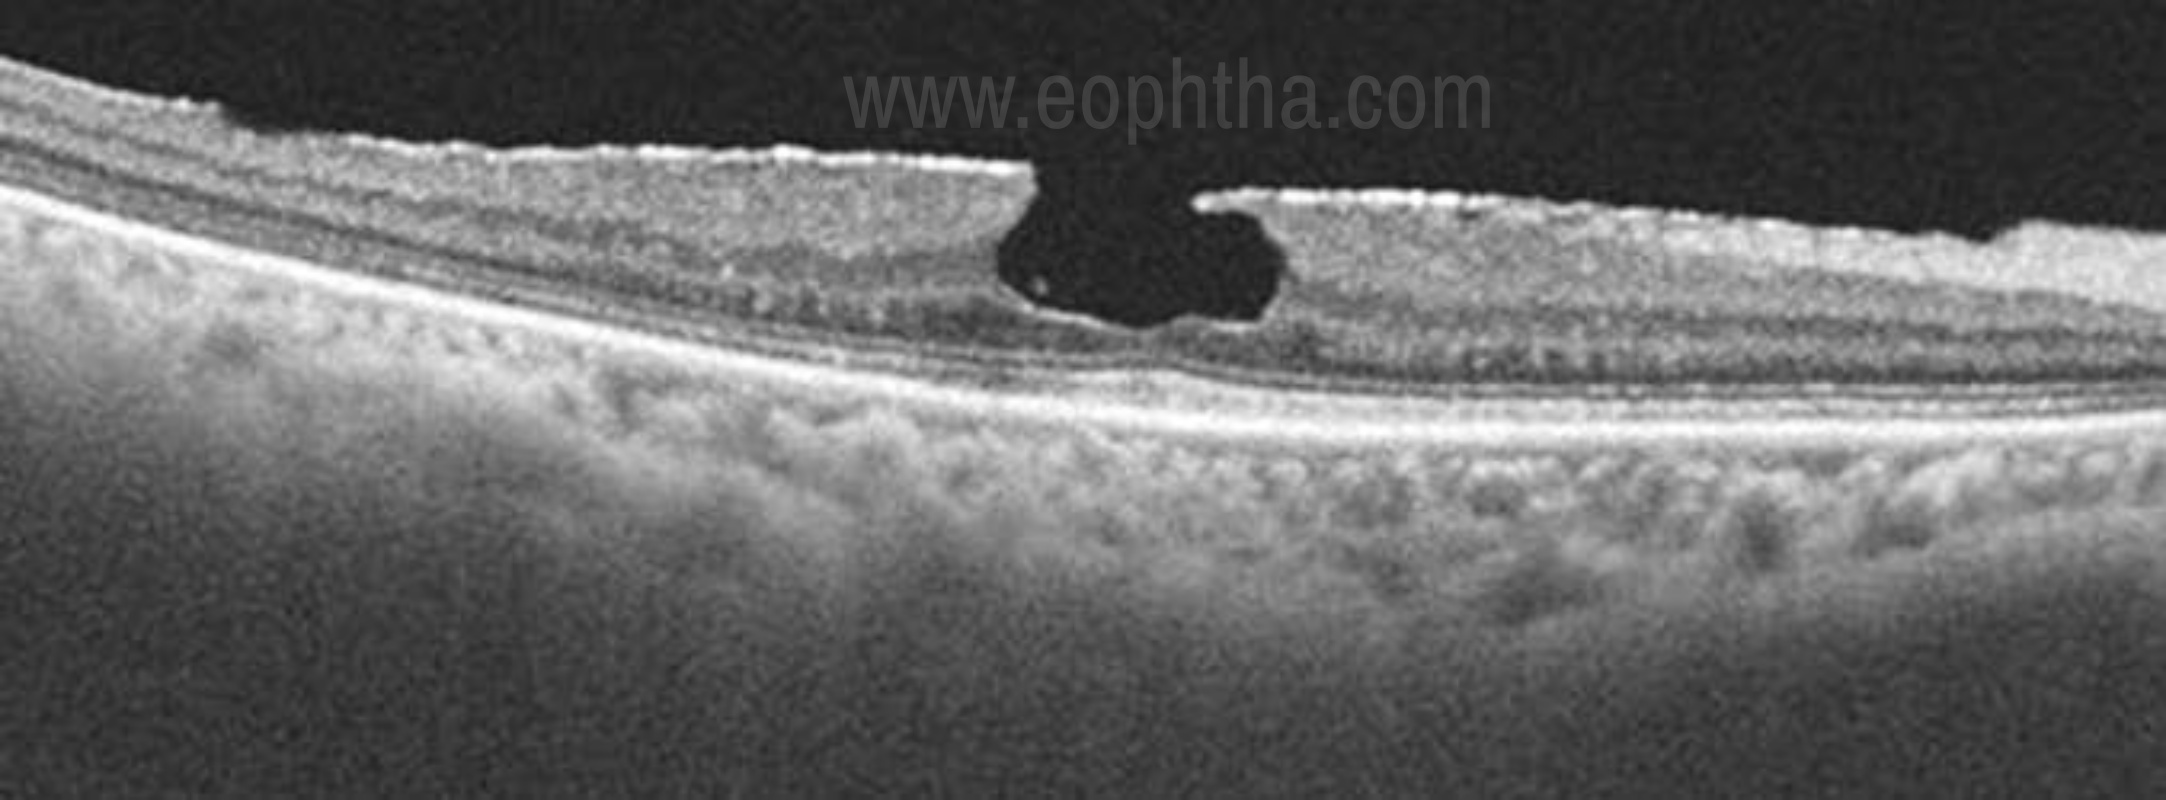
Figure 8. Macular pseudo hole- A broadly adherent ERM is evident. The contour of the fovea is steepened by contraction of the membrane, leading to the appearance of the macular hole on clinical examination. However, there is no loss of tissue or a break in the fovea.
Lamellar macular hole
A lamellar macular hole (LMH) by definition is a partial thickness macular hole, where the inner layers of the macula are involved with traction and detached from the underlying cellular layers. Clinical detection of early LMH may be difficult using biomicroscopy alone. OCT-based features of LMH include the following: (1) an irregular foveal contour; (2) a defect in the inner fovea (may not have actual loss of tissue); (3) intraretinal splitting (schisis), typically between the outer plexiform and outer nuclear layers; and (4) maintenance of an intact photoreceptor layer. A lamellar macular hole can be distinguished from FTMH on OCT best by the presence of intact photoreceptors at the base (Fig 9). [34]
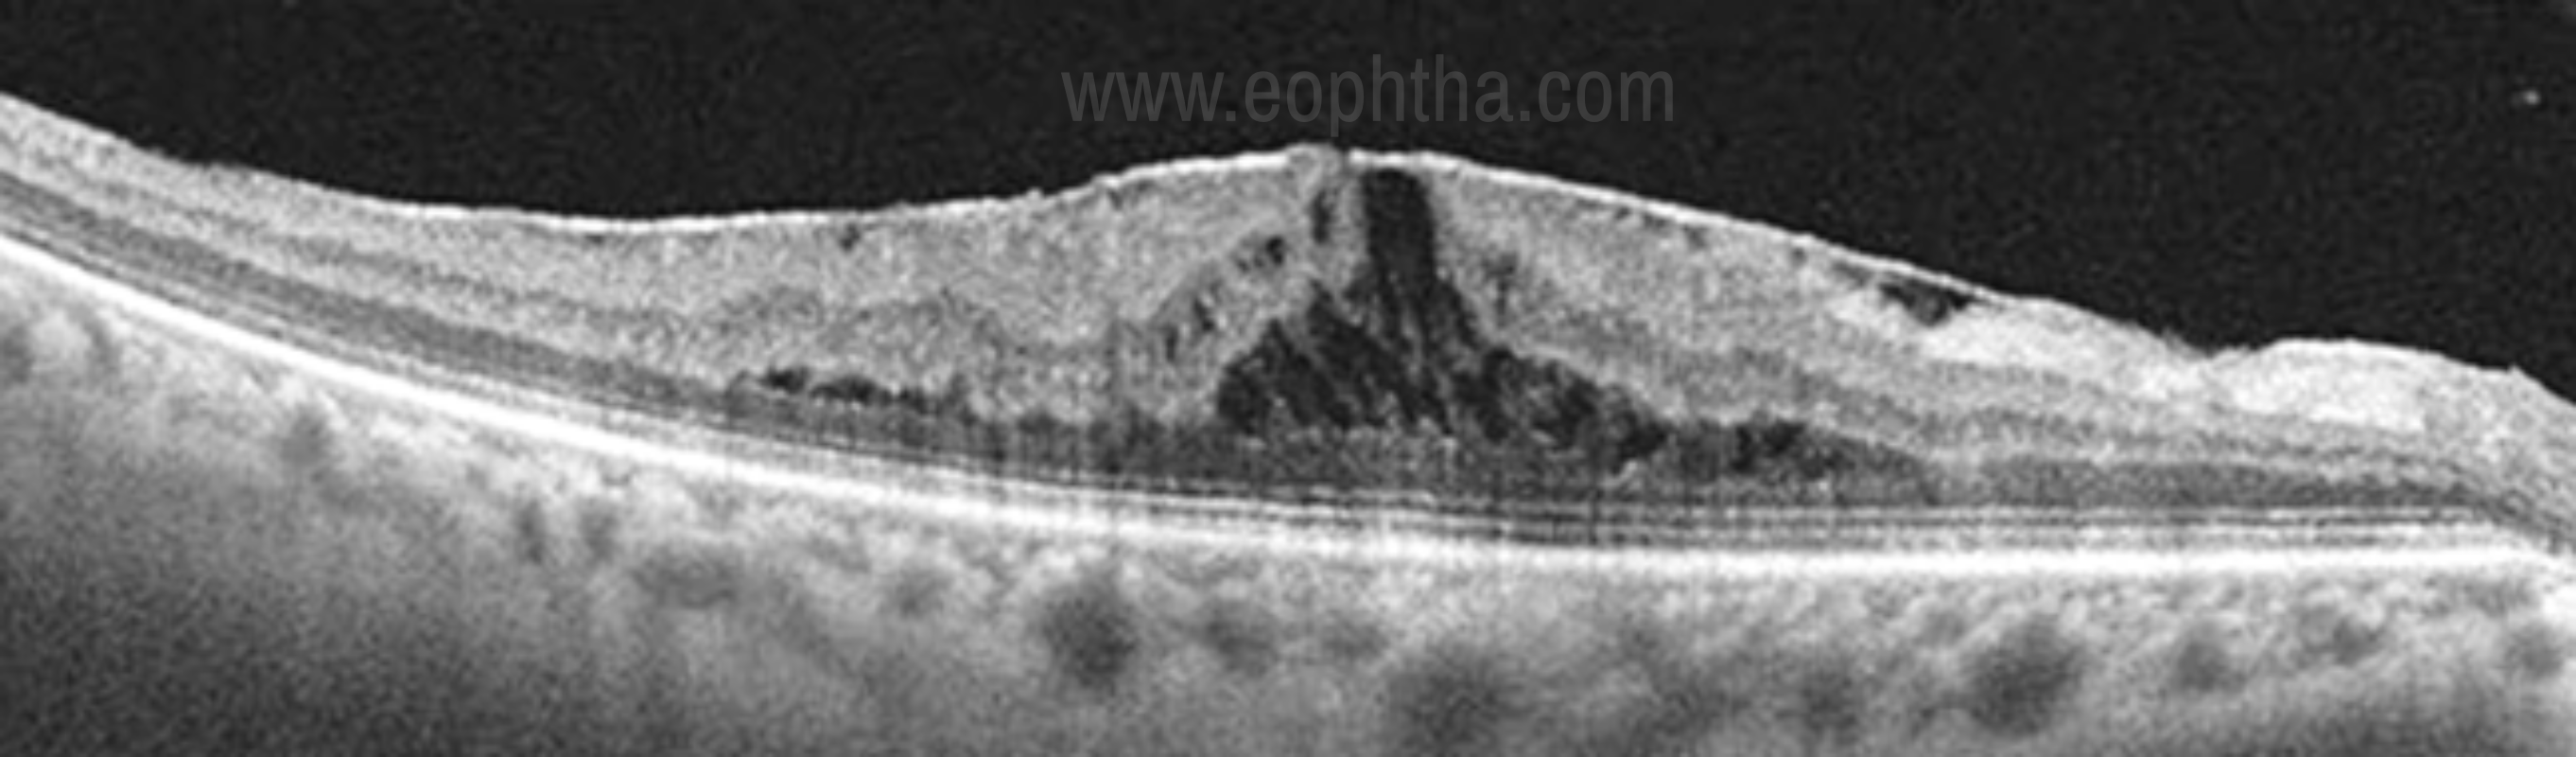
Figure 9. Lamellar macular hole- Note the separation of the inner from the outer foveal retinal layers leading to an intraretinal split and absence of a full-thickness foveal defect with intact photoreceptors.
Macular hole
A full-thickness macular hole is an anatomic defect in the fovea featuring interruption of all neural retinal layers from the ILM to the RPE. [27] OCT is useful in following the progression and monitoring of macular holes. According to OCT, macular holes have been classified into 4 stages (Fig 10).
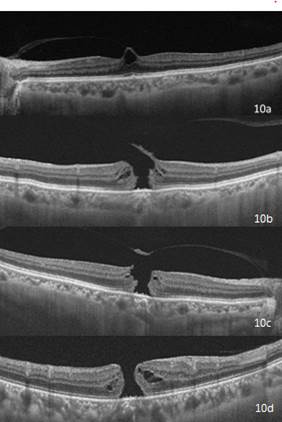
Fig 10- OCT based classification of macular hole. Fig 10a- Stage 1 macular hole, 10b- Stage 2 macular hole, 10c- Stage 3 macular hole, 10d- Stage 4 macular hole.
Stage 1Impending macular hole- In OCT stage 1 macular hole is seen as an intraretinal cyst or split in the outer retinal layers with prefoveal vitreous cortex exerting a tangential force centripetally.
Stage 2OCT shows a large opening in the photoreceptor layer and an incomplete opening of the operculum, with posterior hyaloid still attached to the operculum.
Stage 3Localized separation of the posterior vitreous cortex is noted with the presence of an operculum, which is hyperreflective on OCT.
Stage 4This is a large stage 3 macular hole with no visible operculum as the posterior hyaloid has collapsed and lies too anterior to be imaged in a single frame along with the retina.
A newer OCT-based classification system described by the International Vitreomacular Traction Study (IVTS) group [27], has determined macular holes to be small, medium, or large based on the aperture size. (Table 3)
|
Table 3. Characteristic attributes of Clinical Stages of the International Vitreomacular Traction Study Classification System for Macular Hole [27] |
||
|
Small FTMH |
Hole ≤ 250 µm, may be round or have a flap adherent to vitreous; operculum may or may not be present |
Visual acuity may be relatively good; optimal size for successful repair by pharmacologic vitreolysis; very high probability of success with vitrectomy surgery |
|
Medium FTMH |
Hole >250 but 400 µm; maybe round or have a flap adherent to vitreous; operculum may or may not be present |
High probability of success with vitrectomy surgery |
|
Large FTMH |
Hole >400 µm; vitreous more likely to be fully separated from macula |
Slightly less probability of successful closure with vitrectomy surgery |
Macular edema
OCT greatly enhanced our ability to detect macular thickening and has brought new insights on the morphology of macular edema. Macular edema can be caused by many conditions including metabolic (diabetes), aging (macular degeneration), hereditary (retinitis pigmentosa), inflammatory (sarcoidosis, uveitis), toxic, neoplastic (eye tumors), traumatic, surgical, and unknown causes (VMT). With OCT different patterns of macular edema has been described. [35, 36]
Focal or diffuse macular edema- Initially it appears as a reduction in the reflectivity of the tissue associated with increased retinal thickness. Later the retina appears spongy.
Cystoid macular edema (CME) - Here fluid accumulates in well- defined spaces in the vicinity of outer plexiform layer. The typical arrangement of cystoid cavities in the fovea is attributed to the vertical configuration of muller fibres in the retina. (Fig 11)
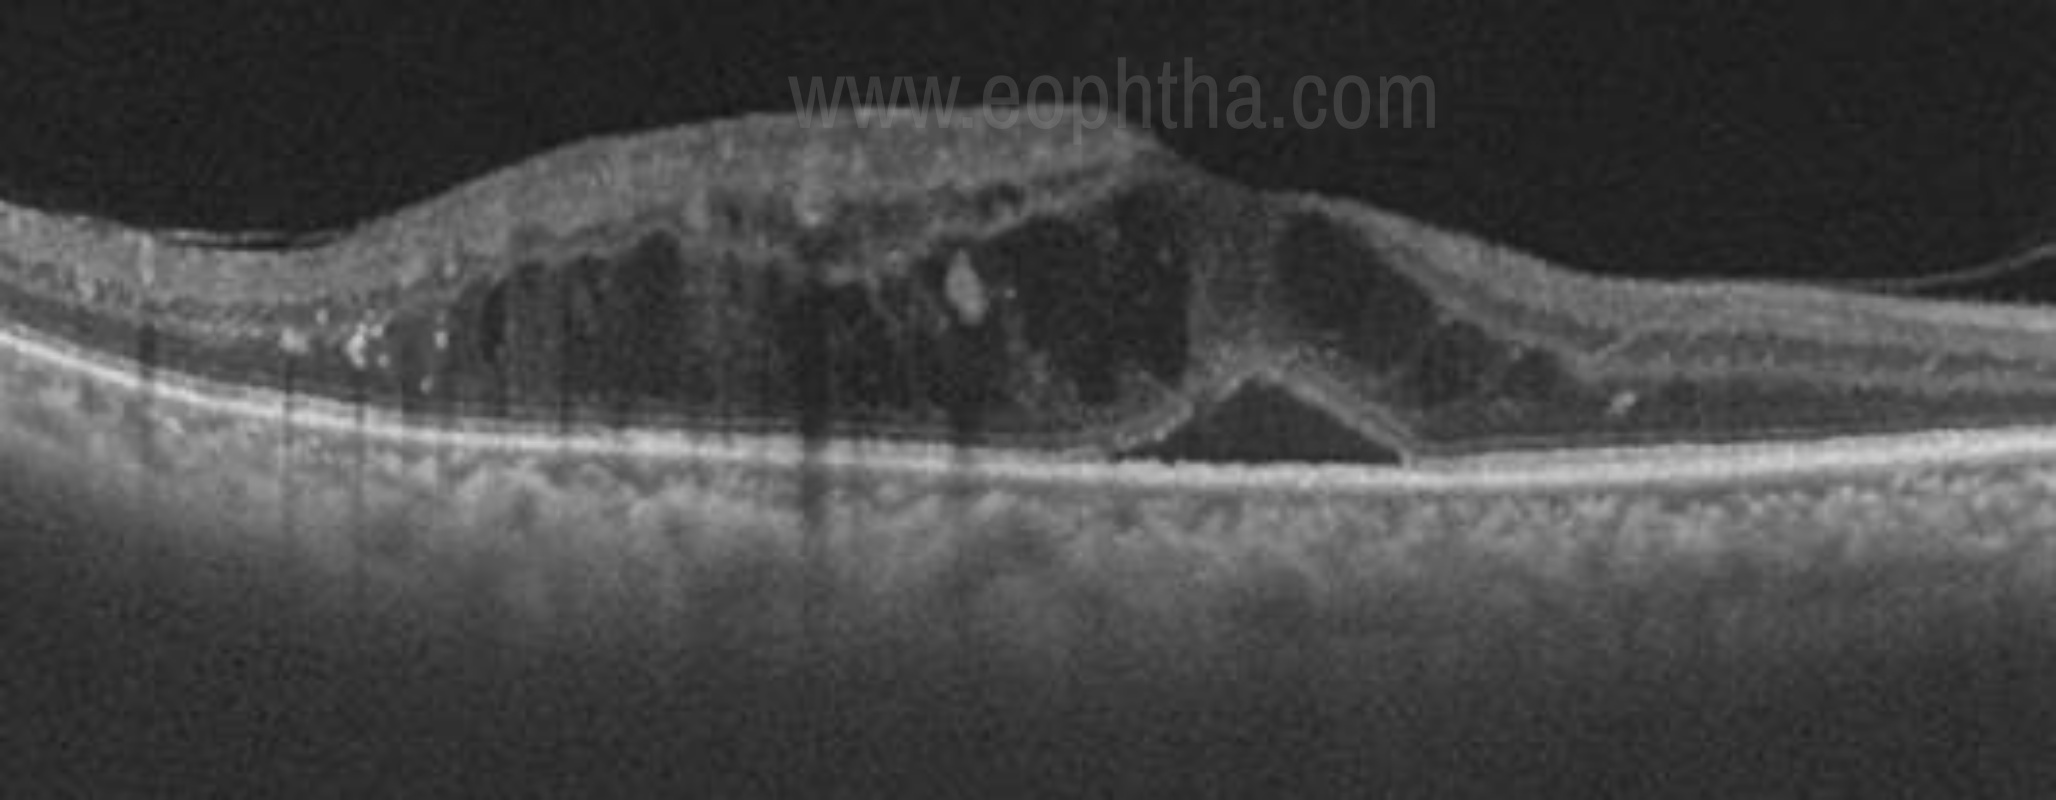
Fig 11. OCT patterns in DME- Subretinal fluid ( SRF), cystoid macular edema (CME)
Serous detachment (SRD) - In a case of SRD, the fluid gets collected in between the RPE and neurosensory retina. It is seen as a dome-shaped elevation of the neurosensory retina over the RPE. (Fig 11)
Quantification of retinal thickness and volume can be performed with serial OCT scans, which is helpful in evaluating temporal trends and treatment effects.
Subretinal pathologies
Age-Related macular degeneration
OCT has evolved as a fundamental tool in the diagnosis and management of patients with AMD. It is extremely useful to detect subtle disease activity much before clinical examination.
Dry AMD is characterized by the presence of drusen. On OCT, drusen appear as RPE deformation or thickening that may form irregularities and undulations. (Fig 12a) In later stages of the disease OCT scans show reduced retinal thickness, increased RPE reflectivity due to reduced light attenuation by atrophic retinal tissue. [36, 37]
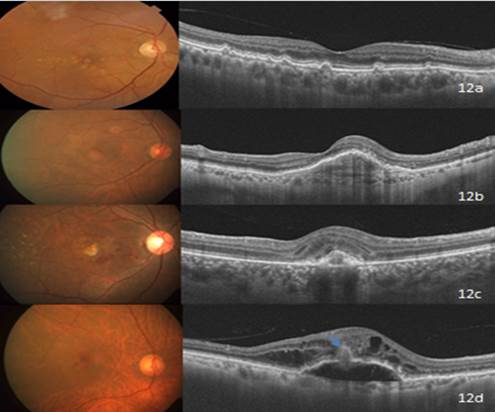
Fig 12a. Dry- AMD- Drusen are seen as undulations and elevations in the hyperreflective band of the RPE with less reflective material beneath them. 12b. Type 1 CNVM (Occult)- Seen as fibrovascular PED in the OCT. 12c. Type 2 CNVM (Classic)- Note the hyperreflective lesion above the level of RPE in the OCT scan. 12d. Type 3 CNVM (RAP)- Characterized by intraretinal cyst-like fluid accumulation, gently sloping dome-like PED, and the presence of an intraretinal – subretinal hyperreflective mass lesion (blue arrow).
Wet form of the disease will have the neovascular membrane seen as a visible focal or broadband of RPE- choriocapillaris complex. [38, 39] Secondary exudation may be seen as intraretinal or subretinal fluid. The highly reflective RPE band on OCT imaging appears thickened or damaged in CNVM with further disruptions above and/or below the RPE indicating serous fluid, hemorrhage, or lipid exudates. With respect to the location of CNVM membrane in relation to retinal pigment epithelium, it has been classified as
Type 1 CNVM- Here the membrane is seen beneath the RPE layer and appears as a fibrovascular or hemorrhagic pigment epithelial detachment. OCT reveals pigment epithelial detachment (PED) with irregular external band and variable subretinal or intraretinal fluid. (Fig 12b)
Type 2 CNVM- Appears above the RPE layer with subretinal fluid, indicating activity. (Fig- 12c)
Type 3 CNV or Retinal angiomatosis proliferans (fig 12d) - Retinal angiomatosis proliferation is a subtype of neovascular AMD that is characterized by retinal–retinal or retinal-choroidal anastomosis. OCT features include intraretinal fluid spaces in the presence of a gently sloping dome-shaped PED and an intraretinal or intraretinal-subretinal pigment epithelial hyperreflective mass lesion.[40,41]Treatment regimens based on OCT have proven to be very effective in preserving vision in patients with AMD.
Central Serous Retinopathy (CSR)
In CSR, the serous fluid with or without subretinal precipitates causes the dome-shaped elevation of the neurosensory retina. Optical coherence tomography demonstrates subretinal fluid, often associated with a focal pigment epithelial detachment(fig 13). [42]More recently, enhanced-depth imaging spectral-domain OCT has shown increased subfoveal choroidal thickness in some patients with CSCR as compared to normal eyes.[ 43] The retinal architecture is preserved in acute cases, whereas chronic cases will have cystoid spaces in the overlying retina (Figure 14).
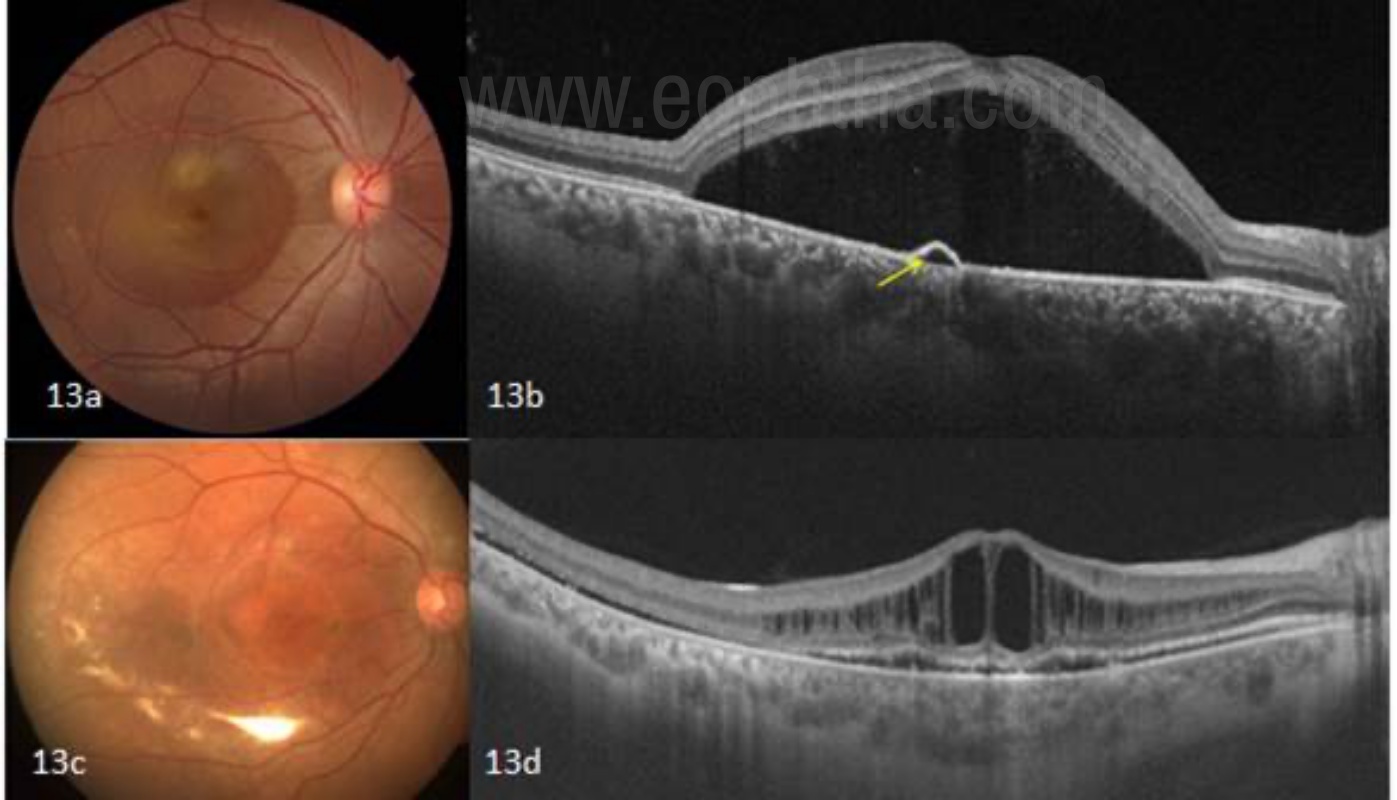
Fig 13a and 13 b- Acute Central serous retinopathy- SD-OCT showing subretinal fluid associated with a focal pigment epithelial defect (yellow arrow). Chronic CSCR eyes develop multiple intraretinal cystoid changes at the outer plexiform layers as a result of the long-standing edema as shown in fig 13 c and d.
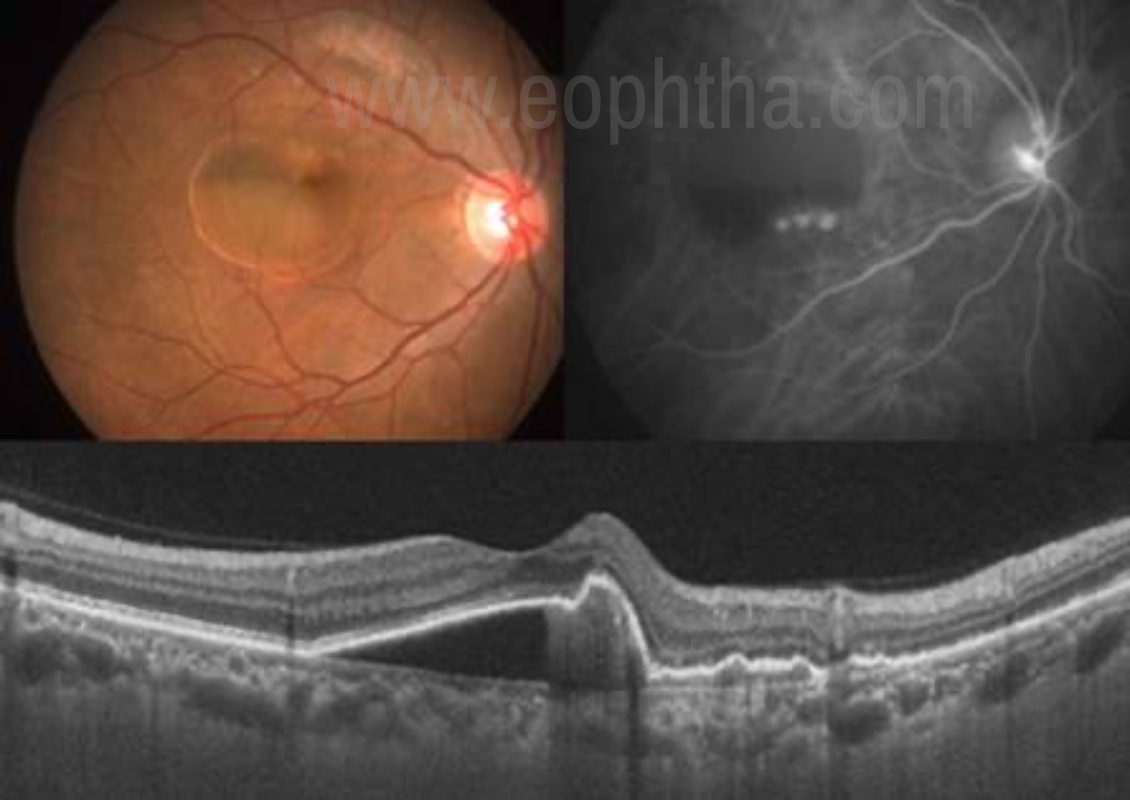
Fig 14. PCV- Vertical scan with SS-OCT reveals PCV as a peaked serosanguinous PED adjacent to the polypoidal bulges, creating a tomographic notch. (Arrow)
Polypoidal choroidal vasculopathy
Polypoidal choroidal vasculopathy (PCV) is characterized by a network of branching inner choroidal vessels with terminal, polyp-like aneurismal dilations. [44] The most common clinical features associated with PCV are exudative and hemorrhagic detachments of the neurosensory retina and RPE. [45] OCT allows for easy identification of serous RPE or neurosensory detachments, in particular, if the presentation is subtle. The polypoidal lesions appear as sharp dome-like elevations of the RPE with moderate inner reflectivity (Figure 15). [46]
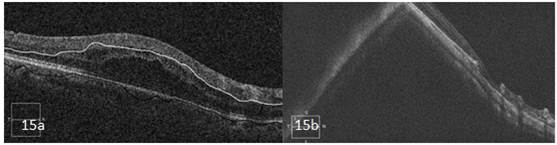
Fig 15. Common artifacts on SD- OCT. 15a. Segmentation artifact- Here the outer and inner boundaries are misidentified leading to an artifact.15b. Mirror artifact: Image appears to be folded onto itself in a high myopic eye; called as mirror artifact.
Artifacts in OCT
Artifacts are defined as anomalies in the scan that are not accurate images of actual physical structures, but are rather the result of an external agent or action. The artifacts can be a result of software errors (misidentification of retinal layers, mirror artifact, cut edge artifact), operator related error (degraded image scan, out of register artifact, off-center artifact) or patient-related factors (motion artifact, off-center artifact, degraded image scan, mirror artifact). [47] Knowledge about the possible artifacts in an OCT image and its avoidance will aid in better interpretation of the disease condition.(Figure 16)
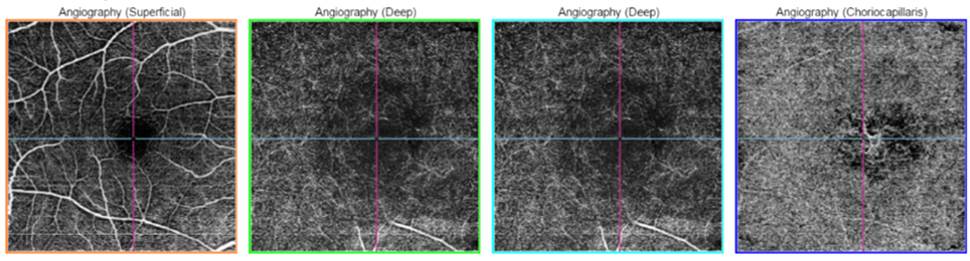
Fig 16- OCTA- showing the vascular network in the choriocapillaris layer in a case of CNVM.
Widefield OCT
Widefield OCT system developed in Optovue (Fremont, CA) Avanti RTVue-XR uses SD technology and can obtain 70,000 A-scans/second. It can create 12 mm x 9 mm B-scans and offers 3-µm digital resolution, providing detailed imaging of both the choroid and the retina. In clinical practice it aids visualization of macular disorders that span greater areas than standard scan widths. Second, application of this OCT technology to the retinal periphery would aid in the diagnosis and follow-up of peripheral retinal disorders. [48, 49]
OCT Angiography
OCT angiography (OCTA) is a noninvasive, dye less method of retinal imaging based on motion contrast imaging to generate angiographic images in a matter of seconds. OCTA compares the decorrelation signal scans taken at precisely the same cross-section in order to construct a map of retinal and choroidal blood flow. It provides information of vascular perfusion at superficial inner retina, deep retina, outer retina and choriocapillaries levels (Figure 16). OCTA has been shown to be a useful imaging modality for the evaluation of common ophthalmologic diseases such as age-related macular degeneration, diabetic retinopathy, and vascular occlusions. Constrains of this technology include a limited field of view, inability to view leakage, increased potential for artifacts and inability to detect blood flow below the slowest detectable flow. [50]
Adaptive Optics OCT (AO-OCT)
Adaptive Optics is not an imaging modality, but rather a technology that can be used in combination with imaging modalities to improve their performance. AO works by measuring and correcting ocular aberrations in real-time.AO provides improved lateral resolution and OCT provides improved axial resolution.In combination with an adaptive optics slit lamp ophthalmoscope, AO-OCT can acquire both OCT and SLO (Scanning Laser Ophthalmoscope) images in vivo with a resolution of 3.5 μm. [51]
Conclusion
OCT technology has revolutionized the management of patients with vitreorertinal diseases and has become an integral part of the clinical practice. A systematic method of interpretation and an awareness of the possible errors, limitations, and artifacts are vital. Advances in OCT technology including choroidal imaging, OCT angiography has improved understanding of various chorioretinal disorders. OCT technology appears to be an ever-evolving field with a much bright future and leading to better patient care.
References
- Huang D et al. Optical coherence tomography. Science, 1991. 254(5035): p. 1178-81.
- Riederer, S.J. (2000). "Current technical development of magnetic resonance imaging".IEEE Engineering in Medicine and Biology Magazine.19(5): 34–1.
- M. Born; E. Wolf (2000).Principles of Optics: Electromagnetic Theory of Propagation, Interference, and Diffraction of Light. Cambridge University Press.
- Fercher, A. F.; Mengedoht, K.; Werner, W. (1988). "Eye-length measurement by interferometry with partially coherent light".Optics Letters.13(3): 186–8.
- E.A. Swanson, D. Huang, M.R. Hee, J.G. Fujimoto, C.P. Lin, C.A. Puliafito 1992 High-speed optical coherence domain reflectometry Opt. Lett. 17 151-153
- M. Wojtkowski, R.Leitgeb, A. Kowalczyk, T. Bajraszewski, A.F.Fercher, “In-vivo human retinal imaging by Fourier domain optical coherence tomography”, J. Biomed. Opt. 7, 457- 463, 2002.
- S. H. Yun, G. J. Tearney, B. E. Bouma, B. H. Park, J. F. de Boer, “High-speed spectraldomain optical coherence tomography at 1.3 m wavelength”, Opt. Express 11, 3598-3604, 2003.
- R. A. Leitgeb, C. K. Hitzenberger, A. F. Fercher, “Performance of Fourier domain vs. time domain optical coherence tomography”, Opt. Express 11, 889-894, 2003.
- Rahman W, Chen FK, Yeoh J et al. Repeatability of manual subfoveal choroidal thickness measurements in healthy subjects using the technique of enhanced depth imaging optical coherence tomography. Invest Ophthalmol Vis Sci 2011; 52: 2267-2271.
- Spaide RF, Koizumi H, Pozzoni MC. Enhanced depth imaging spectral-domain optical coherence tomography. Am J Ophthalmol. 2008;146(4):496-500. Epub 2008 Jul 17.
- Povazay B, Hermann B, Unterhuber A, et al., Three-dimensional optical coherence tomography at 1050 nm versus 800 nm in retinal pathologies: enhanced performance and choroidal penetration in cataract patients. J Biomed Opt. 2007;12:041211.
- Adhi M, Duker JS. Optical coherence tomography – Current and future applications. Curr Opin Ophthalmol 2013;24:213‑21.
- Adhi M, Liu JJ, Qavi AH, Grulkowski I, Lu CD, Mohler KJ, et al. Choroidal analysis in healthy eyes using swept‑source optical coherence tomography compared to spectral-domain optical coherence tomography. Am J Ophthalmol 2014;157:1272‑81.
- Staurenghi G, Sadda S, Chakravarthy U, et al. Proposed lexicon for anatomic landmarks in normal posterior segment spectral-domain optical coherence tomography: The IN*OCT consensus. Ophthalmology 2014;121:1572-8.
- Spaide RF, Curcio CA. Anatomical correlates to the bands seen in the outer retina by optical coherence tomography: Literature review and model. Retina 2011;31:1609-19.
- Saxena S, Srivastav K, Cheung CM, et al. Photoreceptor inner segment ellipsoid band integrity on spectral-domain optical coherence tomography. Clin Ophthalmol 2014;8: 2507-22.
- Staurenghi, Giovanni et al. Proposed Lexicon for Anatomic Landmarks in Normal Posterior Segment Spectral-Domain Optical Coherence Tomography. Ophthalmology , Volume 121 , Issue 8 , 1572 – 1578.
- Forooghian F, Cukras C, Meyerle CB, Chew EY, Wong WT. Evaluation of time domain and spectral domain optical coherence tomography in the measurement of diabetic macular edema. Invest Ophthalmol Vis Sci. 2008;49(10):4290–4296.
- Hatef E, Khwaja A, Rentiya Z, et al. Comparison of time domain and spectral domain optical coherence tomography in measurement of macular thickness in macular edema secondary to diabetic retinopathy and retinal vein occlusion. J Ophthalmol. 2012;2012:354783.
- Ho J., Sull A.C., Vuong L.N., Chen Y., Liu J., Fujimoto J.G. Assessment of artifacts and reproducibility across spectral- and time-domain optical coherence tomography devices.Ophthalmology.2009;116:1960–1970.
- Mitchell P., Korobelnik J.F., Lanzetta P., Holz F.G., Prunte C., Schmidt-Erfurth U. Ranibizumab (Lucentis) in neovascular age-related macular degeneration: evidence from clinical trials.Br J Ophthalmol.2010;94:2–13.
- Mitry D., Bunce C., Charteris D. Anti-vascular endothelial growth factor for macular oedema secondary to branch retinal vein occlusion.Cochrane Database Syst Rev.2013;1:CD009510.
- Foos RY, Wheeler NC. Vitreoretinal juncture. Synchysis senilis and posterior vitreous detachment. Ophthalmology. 1982;89:1502–1512. 10.
- Jaffe N. Complications of acute posterior vitreous detachment. Arch Ophthalmol 1968;79:568–571. 11.
- Kanski J. Complications of acute posterior vitreous detachment. Am J Ophthalmol. 1975;80:44–46. 12.
- Novak M, Welch R. Complications of acute symptomatic posterior vitreous detachment. Am J Ophthalmol 1984;97: 308–314.
- Duker JS et al. The International Vitreomacular Traction Study Group classification of vitreomacular adhesion, traction, and macular hole. Ophthalmology.2013 Dec;120(12):2611-9.
- Sebag J. Age-related changes in human vitreous structure. Graefes Arch Clin Exp Ophthalmol 1987;225:89–93.
- Russell SR, Shepherd JD, Hageman GS. Distribution of glycoconjugates in the human retinal internal limiting membrane. Invest Ophthalmol Vis Sci 1991;32:1986–95.
- Johnson MW. Posterior vitreous detachment: evolution and role in macular disease. Retina 2012;32(suppl):S174–8.
- Suzuki T, Terasaki H, Niwa T. (2003). Optical coherence tomography and focal macular electroretinogram in eyes with epiretinal membrane and macular pseudohole. Am J Ophthalmol, Vol. 136, No. 1, (Jul), pp. 62-67.
- Massin P, Allouch C, Haouchine B, Metge F, Pâques M, et al. (2000). Optical coherence tomography of idiopathic macular epiretinal membranes before and after surgery. Am J Ophthalmol, Vol. 130, No. 6, (Dec), pp. 732-739.
- Chen JC, Lee LR. Clinical spectrum of lamellar macular defects including pseudoholes and pseudocysts defined by optical coherence tomography.Br J Ophthalmol.2008;92:1342-1346.
- Witkin AJ, Ko TH, Fujimoto JG, et al. Redefining lamellar holes and the vitreomacular interface: an ultrahigh-resolution optical coherence tomography study.Ophthalmology.2006;113:388-397.
- Taylor SR, Lightman SL, Sugar EA, et al. The impact of macular edema on visual function in intermediate, posterior, and panuveitis. Ocul Immunol Inflamm 2012;20:171–8.
- Tsukada K, Tsujikawa A, Murakami T, et al. Lamellar macularhole formation in chronic cystoid macular edema associated with retinal vein occlusion. Jpn J Ophthalmol 2011;55: 506–13.
- Mavrofrides EC, Cruz-Villegas V, Puliafito CA. Miscellaneous retinal diseases. In: Schuman JS, Puliafito CA, Fujimoto JG, eds. Optical coherence tomography of ocular diseases. Thorofare, NJ: SLACK, Inc.; 2004:457-482.
- Giovannini A, Amato G, Mariotti C, Scassellati-Sforzolini B. (2000). Optical coherence tomography in the assessment of retinal pigment epithelial tear. Retina, Vol. 20, No. 1, pp. 37-40.
- Rogers AH, Martidis A, Greenberg PB, Puliafito CA. (2002). Optical coherence tomography findings following photodynamic therapy of choroidal neovascularisation. Am J Ophthalmol, Vol. 134, No. 4, (Oct), pp. 566-576.
- Lim E-H, Han J-I, Kim CG, Cho SW, Lee TG. Characteristic Findings of Optical Coherence Tomography in Retinal Angiomatous Proliferation.Korean Journal of Ophthalmology : KJO. 2013;27(5):351-360. doi:10.3341/kjo.2013.27.5.351.
- R. Brancato, u. Introini,Pierro, M. Setaccioli et al. Optical coherence tomography (OCT) in retinal angiomatous proliferation (RAP). European Journal of Ophthalmology, Vol. 12; 2002: 467-472.
- Shinojima A, Hirose T, Mori R, et al. Morphologic findings in acute CSC using spectral domain OCT with simultaneous angiography. Retina 2010;30:193-202.
- Imamura Y, Fujiwara T, Margolis RON, Spaide RF. Enhanced depth imaging optical coherence tomography of the choroid in central serous chorioretinopathy. Retina 2009; 29:1469-73.
- Yannuzzi LA. Idiopathic polypoidal choroidal vasculopathy. Presented February 5, 1982 at the Macula Society Meeting, Miami, Florida.
- Ciardella AP, Donsoff IM, Huang SJ, et al. Polypoidal choroidal vasculopathy. Surv Ophthalmol. 2004 Jan-Feb; 49(1):25-37
- Kamaeda T, Tsujikawa A, Otani A, et al. Polypoidal choroidal vasculopathy examined with en face optical coherence tomography. Clin Experiment Ophthalmol. 2007 Sep-Oct;35(7):596-601.
- Chhablani J, Krishnan T, Sethi V, Kozak I. Artifacts in optical coherence tomography.Saudi Journal of Ophthalmology. 2014;28(2):81-87. doi:10.1016/j.sjopt.2014.02.010.
- Klein T, Wieser W, Eigenwillig CM, Biedermann BR, Huber R. Megahertz OCT for ultrawidefield retinal imaging with a 1050 nm Fourier domain modelocked laser. Opt Express. 2011;19:3044–6. 14.
- Povazay B, Hermann B, Hofer B, et al. Widefield optical coherence tomography of the choroid in vivo. Invest Ophthalmol Vis Sci. 2009;50:1856–63.
- Talisa E de Carlo et al A review of optical coherence tomography angiography (OCTA) International Journal of Retina and Vitreous (2015) 1:5
- Miller DT, Kocaoglu OP, Wang Q, Lee S. Adaptive optics and the eye (super resolution OCT). Eye (Lond). 2011;25:321–30.