.jpg)
.jpg)
1. What is fundus autofluorescence?
Fundus autofluorescence is a study of the topographic distribution of naturally occurring molecules in the human fundus. These molecules are called fluorophores. In principle, FAF is similar to fundus fluorescein angiography as both of them study the fluorescence pattern of molecules. However, the fluorophore molecules are naturally occurring compounds in the former while in later sodium fluorescein dye is injected. Hence FAF is a non-invasive imaging modality.
2. What are fluorophores?
Fluorophores are molecules that emit fluorescence when excited by a suitable wavelength of light. Fluorophores are not exclusively present in the fundus and are distributed in various ocular tissue which includes the cornea, lens, uvea melanocyte, retinal pigment epithelium (RPE), and sclera.1,2 The knowledge about fluorophores other than fundus is still evolving. The commonly studied fundus fluorophores lipofuscin and melanin.
3. Lipofuscin and melanin
Lipofuscin is found throughout the retina and its concentration increases from the equator to the posterior pole except at the fovea.3,4 It is a complex mixture of partially digested lipid and protein which absorbs blue light with a peak wavelength of 470 nm and emits yellow-green light at a peak wavelength 600-610 nm.5 Lipofuscin based autofluorescence is also known as blue autofluorescence (BAF), short wave autofluorescence (SWAF) or simply autofluorescence. Melanin has a peak excitation at wavelength of 787 nm and it emits fluorescence in the near-infrared region.6 It is distributed in the fovea, macula, and periphery. Melanin based autofluorescence is also known as near-infrared autofluorescence. (NIRAF)
4. Normal BAF and NIRAF
The BAF image of the normal eye shows optic disc and vessels as dark and the fundus as grey in color (Figure 1A). Normal NIRAF image also shows optic disc and vessels as dark and retina as grey in color. (Figure 1B) However, the fovea is differentiating point between the two. In BAF the fovea is dark whereas, in NIRAF, the fovea is the brightest point as it is rich in melanin. Both BAF and NIRAF can be differentiated from the red-free images by the darker appearance of the optic disc and retinal blood vessels compared to the red-free images.
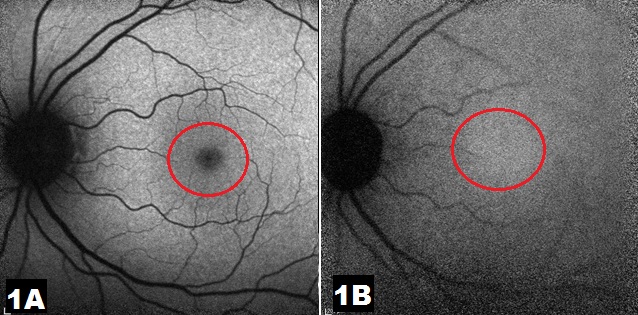
disc and blood vessels. The retina is greyish in color and the fovea (red ring) is
dark as well. Figure 1B: Near infrared autofluorescence (NIRAF) image of normal
left eye shows dark optic disc and blood vessels. The retina is greyish in color
and the fovea is (red ring) is the brightest point of the image.
5. Effect of light exposure on autofluorescence imaging
Prolonged light exposure changes the rhodopsin pigment present in the outer segment of rod photoreceptors. Normally rhodopsin absorbs the excitation light of BAF more than NIRAF. In a dark-adapted eye, rhodopsin remains active unhindered and absorbs excitation light leading to reduced autofluorescence signals. However, after prolonged exposure to light, it undergoes photo-isomerization and loses its absorption capacity. Hence prolonged light exposure increases the BAF signals to a significant level and NIRAF signals to a lesser extent. This is called bleaching effect and leads to increased autofluorescence signals after prolonged light exposure.6
6. Interpretation of fundus autofluorescence
Similar to fluorescein angiography, fundus autofluorescence can increase or decrease. Increased autofluorescence is called hyperautofluorescence (hyperAF) and a decrease is called hypoautofluorescence (hypoAF). HyperAF can be a result of increased accumulation of lipofuscin in diseases like pattern dystrophy, vitelliform dystrophies, or Stargardt’s disease. HyperAF is also noted at the rolled edge of the retinal pigment epithelium tear. HypoAF can be caused by reduced or absent lipofuscin in retinal pigment epithelium as in cases of retinal pigment epithelium atrophy, tear, and geographic atrophy. It can also be caused by blocked autofluorescence due to media opacities. Naturally, leutein and zeaxanthin are the pigments that block the autofluorescence at the fovea. Retinal and subretinal hemorrhage and scar also block the autofluorescence.
7. Autofluorescence in choroiditis
Active choroiditis is characterized by diffuse hyperAF of the entire lesion. As the lesion starts to heal with treatment the choroiditis lesion develops a rim of hypoAF along with fading central hyperAF. With complete healing of the lesion, the entire choroiditis area turns hypoAF. Autofluorescence imaging may be a non-invasive tool to assess treatment response in choroiditis.
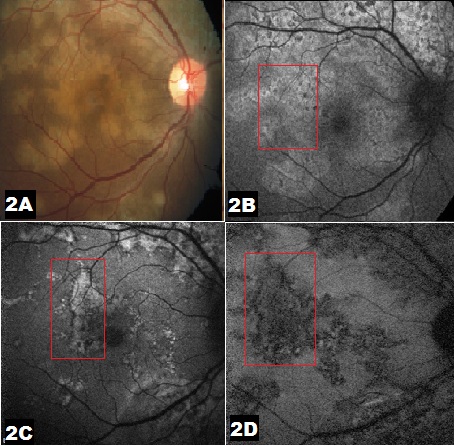
choroiditis. Figure 2B: BAF image before start of treatment shows
diffuse hyperAF of entire choroiditis lesion.Figure 2C: BAF
image shows a rim of hypoAF (red rectangle) with fading central
hyperAF with institution of treatment with immunosuppressive.
Figure 2D: BAF image shows diffuse hypoAF (red rectangle)
once the choroiditis has healed.
8. Autofluorescence in central serous chorioretinopathy
Central serous chorioretinopathy (CSC) can present as short-lived acute disease or as a chronic recurrent ailment. Autofluorescence signals in CSC vary according to the stage of the disease. In the acute stage of the first episode of CSC, the subretinal fluid blocks the autofluorescence causing hypoAF. A retinal pigment epithelium detachment (PED) within the subretinal fluid shows up as hyperAF. Chronic CSC causing atrophy of retinal pigment epithelium may lead to a predominantly hypoAF signal. Subretinal precipitates seen clinically in CSC are rich in fluorophores and are seen as discrete hyperAF spots.
9.Autofluorescence in age-related macular degeneration
Autofluorescence signals of age-related macular degeneration (AMD) depend upon the stage of the disease. Small drusen may remain inconspicuous. Intermediate drusen show central hypoAF due to central RPE atrophy and rim of hyper AF due to RPE stress. Though large soft drusen and drusenoid PED are generally hyperAF, there may be variable autofluorescence signatures based on associated RPE atrophy. Area of geographic atrophy appears as hypoAF. Choroidal neovascularization is generally hypoAF due to blockage of autofluorescence by hemorrhage or exudate. The margin of CNV may have hyperAF signals due to RPE stress and increased production of lipofuscin.
10.Use of NIRAF
NIRAF is an evolving imaging modality. It has been used alongside BAF to study diseases that affect melanin distribution at the macula. BAF shows the arcuate zone of perifoveal hyperAF in hydroxychloroquine retinopathy. NIRAF, on the other hand, shows smaller foveal hyperAF followed by three perifoveal zones of circular hypoAF, arcuate hyperAF and arcuate hypoAF.7 Lesions which are rich in melanin like choroidal nevus are not picked up on BAF and are seen as hyperAF lesion on NIRAF.8
References:
- Boulton M, Rózanowska M, Rózanowski B. Retinal photodamage. J Photochem Photobiol B Bio. 2001;64(23):144–161
- Rovati L, Docchio F. Autofluorescence methods in ophthalmology. J Biomed Opt. 2004;9(1):9–21.
- Delori FC, Dorey CK, Staurenghi G, Arend O, Goger DG, Weiter JJ. In vivo fluorescence of the ocular fundus exhibits retinal pigment epithelium lipofuscin characteristics. Invest Ophthalmol Vis Sci. 1995;36(3):718–29.
- Weiter JJ, Delori FC, Wing GL, Fitch KA. Retinal pigment epithelial lipofuscin and melanin and choroidal melanin in human eyes. Invest Ophthalmol Vis Sci. 1986;27(2):145–52.
- Krebs I, Lois N, Forrester JV. Fundus autofluorescence. Graefes Arch Clin Exp Ophthalmol. 2011;249(2):309
- Madeline Yung, Michael A. Klufas, David Sarraf. Clinical applications of fundus autofluorescence in retinal disease. Int J Retina Vitreous. 2016; 2: 12
- Saurabh K, Roy R, Thomas NR, Chowdhury M. Multimodal imaging characteristics of hydroxychloroquine retinopathy. Indian J Ophthalmol. 2018 Feb; 66(2): 324–327.
- Saurabh K, Roy R, Sinharoy S, Shah D, Nangia P. Measurement of size of pigmented choroidal nevus: Superiority of multicolor imaging compared to conventional color fundus photography. Indian J Ophthalmol. 2018 Oct; 66(10): 1501–1503