


Introduction:
Optical coherence tomography angiography (OCT-A) has emerged as a novel imaging technique for visualizing the retinal and choroidal microvasculature at the macula and optic disc.1 It provides in vivo 3D vascular information by analyzing the movement of flowing red blood cells and thereby enabling the visualization and quantification of functional vessel networks within microcirculatory tissue beds in a non-invasive manner without the use of dye injection.2
Understanding the anatomy of retinal and choroidal microvasculature (figure 1):
Retinal microvasculature:
Studies have identified 4 retinal vascular capillary networks at the macula which are broadly grouped into 2 vascular plexuses; superficial and deep.3 The superficial vascular plexus (SVP) consists of the superficial capillary plexus and radial peripapillary capillary plexus. The former is located in the ganglion cell layer and the latter in the retinal nerve fibre layer. The SVP receives its blood supply from the central retinal artery. The deep vascular plexus (DVP) consists of two deeper capillary networks, located above and below the inner nuclear layer (INL). They are referred to as the “intermediate or middle” and “deep” capillary plexuses, respectively, and are supplied by vertical anastomoses from the SVP.4,5 The DVP has a lobular configuration when compared to the superficial capillary and radial peripapillary capillary plexuses which run parallel to the retinal nerve fibre and ganglion cell layers.6,7
Choroidal microvasculature:
Thechoriocapillarisis a layer ofcapillariesthat is immediately adjacent toBruch's membranein thechoroid.The choriocapillaris forms a single layer of anastomosing, fenestrated capillaries having wide lumina with most of the fenestrations facing toward the retina.The choriocapillaris is densest in the macular area, where it is the sole blood supply for a small region of the retina. The choriocapillaris is unique to the choroid and does not continue into the ciliary body.8
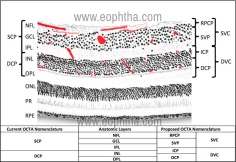
Figure 1: Microvasculature of retina and choroid:
(Source: Chen H, Chen X, Qiu Z, et al (2015) Quantitative analysis of retinal layers’ optical intensities on 3D optical coherence tomography for central retinal artery occlusion. Sci Rep 5:9269. https://doi.org/10.1038/srep09269)
Principle of OCT-Angiography:
OCT-A technology uses laser light reflectance of the surface of moving red blood cells to accurately depict vessels through different segmented areas of the eye, thus eliminating the need for intravascular dyes.2 OCT-A technology is available on both spectral-domain and swept-source OCT platforms. In spectral-domain OCT, the light of 810nm wavelength is used while in swept-source OCT, a light of 1050nm wavelength is used. Longer wavelengths have a deeper tissue penetrance, but a slightly lower axial resolution. OCT-A employs two methods for detecting the motion of red blood cells: A) amplitude-decorrelation or B) phase variance. The former detects differences in amplitude between two different OCT B-scans. Phase variance is related to the emitted light wave properties, and the variation of phase when it intercepts moving objects. To improve visualization and reduce background noise from normal small eye movements and finally to improvise the signal to noise ratio, two averaging methods viz., 1) split spectrum amplitude decorrelation technique and 2) volume averaging methods are developed.9–12OCT-A detects motion and flow of red blood cells only if it is in the detectable velocity range. For the majority of the currently available commercial devices, the detectable velocity ranges from 0.5 – 2 mm/second. The slowest detectable flow is determined by the time interval between two sequential OCT B-scans, and lesions resulting in inflow below the lowest limit of detectable flow cannot be detected.13
Advantages and disadvantages compared to conventional angiography techniques are described in Table 2:
|
OCT-Angiography |
Fluorescein/Indocyanine green angiography |
|
|
Invasive technique |
No |
Yes |
|
Dye required |
No |
Yes |
|
Dye related complications |
No |
Yes |
|
Segmentation of different retinal layers |
Possible |
Not possible |
|
Image artifacts |
More |
Less |
|
3-D imaging |
Yes |
No |
|
Vessel quantification |
Possible |
Not possible |
Table 2: OCT-angiography versus fluorescein/indocyanine green angiography:
Currently, available commercial OCT-A devices are mentioned in Table 114:
|
Device |
OCT platform |
Motion Algorithm |
|
Optovue AngioVue® (Optovue, Inc., Freemont, CA) |
Spectral-domain |
Split-spectrum amplitude-decorrelation angiography(SSADA) |
|
ZEISS Angioplex™ |
Spectral-domain |
OCT- microangiography complex algorithm (OMAG) |
|
Spectralis OCT2 (Heidelberg Engineering, Germany) |
Spectral-domain |
Full-spectrum amplitude-decorrelation angiography (SADA) |
|
Topcon DRI OCT Triton Swept-source OCTA |
Swept Source |
OCTA Ratio Analyses (OCTARA) |
|
Zeiss Plex Elite 9000 |
Swept Source |
OCT-microangiography complex algorithm (OMAG) |
Segmentation of different slabs on OCT-A:
The OCT-A algorithms produce an image (3mm2to 12mm2) that is segmented, by standard, into four zones: the superficial retinal plexus, the deep retinal plexus, the outer retina, and the choriocapillaris (Figure 2).
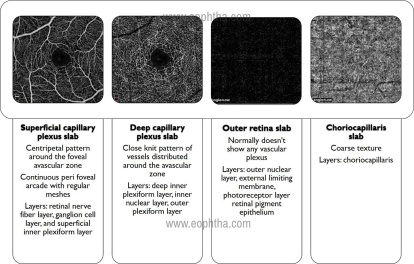
Figure 2: Segmentation of different layers on OCT-angiography
Parameters that can be quantified or measured
1. Vessel density: It is defined as the percentage area occupied by vessels in the segmented area (figure 3).
2. Flow area: It is defined as the average flow signal (which is correlated with flow velocity) in a selected area (figure 4).
3. Non-flow area: It corresponds to the area where there is no flow as in the foveal avascular zone or in the region of capillary loss (figure 5).
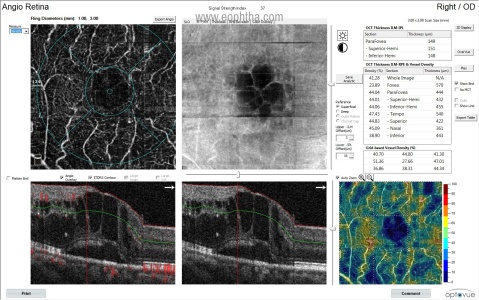
Figure 3: Vessel density map
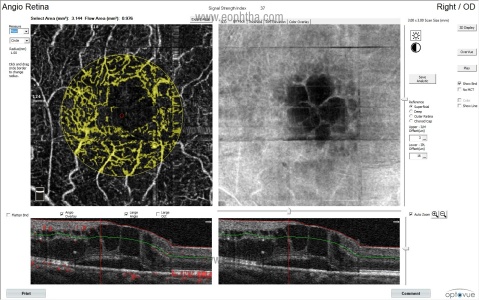
Figure 4: Flow area map
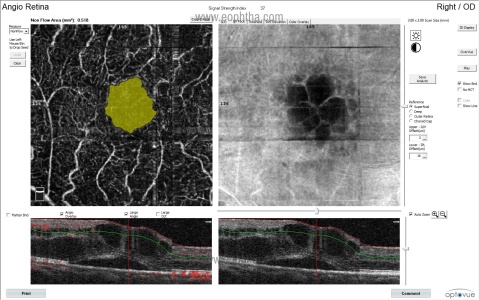
Figure 5: Non-flow area map
Image artifacts15–17:
A. Machine specifications leading to image acquisition artifacts:
OCT machines with the low number of A-scans/second produce more noise and attenuate the signal quality. This can be corrected by having devices that produce a greater number of A-scans/second as in spectral-domain or swept-source OCT. Also, devices using the SSADA algorithm may produce a greater signal-to-noise ratio and generate high-quality images.
B. Motion artifacts:
OCT-A examination is extremely motion-sensitive and requires patient collaboration, which may be difficult to obtain for patients with poor vision (figure 6).
Figure 6: Eye motion and blinking artifacts
C. Projection artifact:
This is inevitable and is related to light that traverses blood vessels and is reflected back by deeper layers (e.g., pigment retinal epithelium), which will appear in the final image with a similar vascular pattern as the overlying vessels (Figure 7).
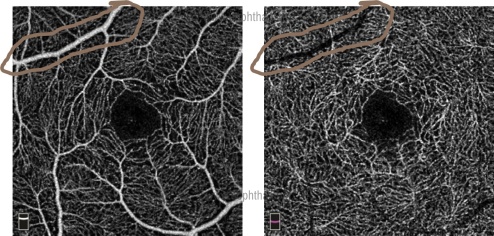
Figure 7: Projection artifact
D. Masking and unmasking artifacts:
Masking and unmasking artifacts occur in regions of pigment epithelial detachment and atrophy (figure 8).
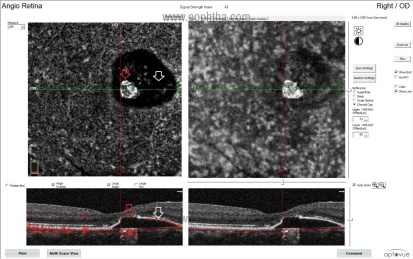
Figure 8: Masking (white arrow) and unmasking (red arrow) artifacts
E. Segmentation artifacts:
Automated segmentation of a structural abnormal retina is an unavoidable limitation of OCT-A imaging. In cases of pigment epithelial detachments or in retinal thinning or thickening as in chronic or acute central retinal artery occlusion, one should look carefully for segmentation errors and manually edit layers if deemed necessary for a correct interpretation (figure 9).
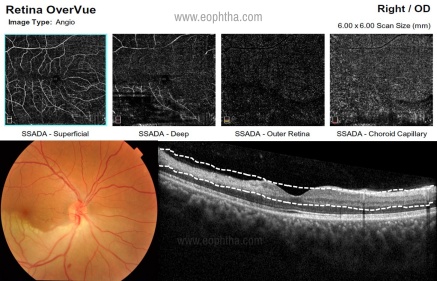
Figure 9: Segmentation artifacts in CRAO
Clinical applications:
A. Diabetic retinopathy (DR):
OCT-A may potentially serve as a useful non-invasive imaging tool in the diagnosis and monitoring of diabetic retinopathy and maculopathy. Recent studies on the role of OCT-A in DR include the use of vascular parameters e.g., vessel density, intercapillary spacing, vessel diameter index, length of vessels based on skeletonized OCT-A, the total length of vessels, vascular architecture, and area of the foveal avascular zone. These quantitative measures may be able to detect changes with the severity and progress of DR. OCT-A may also serve as a non-invasive imaging method to detect diabetic macula ischemia, which may help predict visual prognosis (figures 10-12). However, there are a few limitations of OCT-A in DR such as difficulty in segmentation between superficial and deep capillary plexus; and its use in diabetic macula edema where the presence of cystic spaces may affect image results. OCT-A in the anterior segment include detection of anterior segment ischemia and iris neovascularisation associated with proliferative DR and risk of neovascular glaucoma.18,19
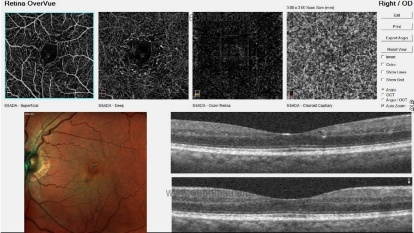
Figure 10: Detection of microaneurysms in DR
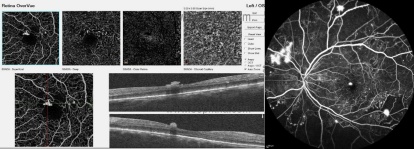
Figure 11: Identification of retinal neovascularization in proliferative DR
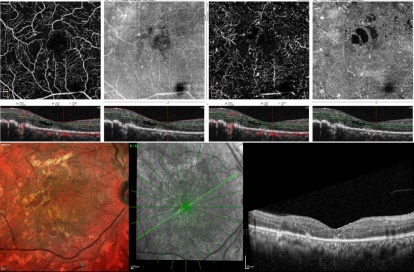
Figure 12: identification of macular ischemia
Clinical Nuggets
- The sensitivity of OCT-A in identifying microaneurysms is more than that with clinical examination with 78D or 90D slit-lamp biomicroscopic examination but inferior to FFA
- To identify macular ischemia
- To detect neovascularization at the disc or elsewhere
B. Retinal arterial occlusion (RAO):
As a valuable non-invasive imaging tool, OCT-A provides deeper and more detailed vascular information that extends our understanding of the vasculature alterations in acute RAO. The vessel density of the superficial capillary plexus, deep capillary plexus, and area around the FAZ gets significantly reduced in acute RAO patients compared with that in the fellow eyes and normal control eyes. In BRAO eyes, the vessel density of the RAO-affected hemifield is significantly reduced compared with that of the unaffected hemifield (Figures 13 and 14).20
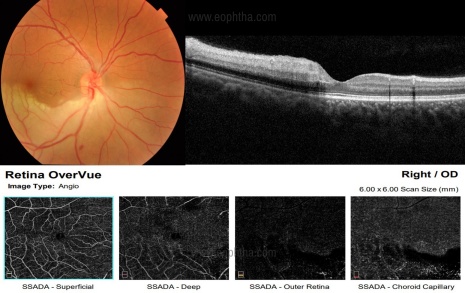
Figure 13: OCT-A findings in hemi-CRAO:
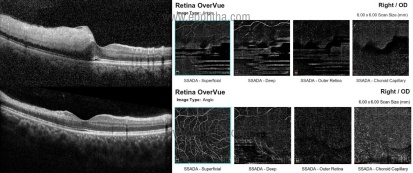
Figure 14: Segmentation problems encountered in acute and chronic stages of BRAO
C. Retinal vein occlusion:
The changes visible on OCT-A in RVO can be described as qualitative and quantitative (Table 3 and figure 15):21
Clinical Nuggets
- Useful in detecting the level of occlusion and severity of the occlusion
- Misinterpretation of imaging findings can happen due to improper segmentation
Table 3: OCT-A findings in retinal vein occlusion:
Quantitative |
Qualitative |
|
|
|
|
|
|
|
|
|
|
|
|
|
|
|
|
|
|
|
|
|
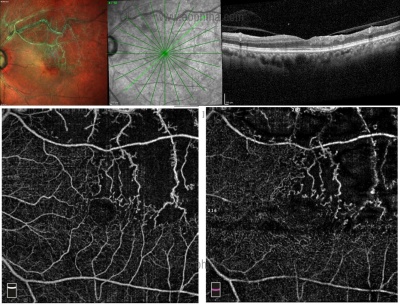
Figure 15: OCT-A findings in chronic supero-temporal BRVO
Clinical Nuggets
- Not useful in acute cases in the presence of extensive retinal hemorrhages and macular edema
- Useful in chronic cases to detect macular ischemia and retinal neovascularization
D. Type 2 Macular telangiectasia (MacTel):
In type 2 MacTel, OCT-A yields findings that are important for understanding the pathogenesis of the disease and providing better follow-up.
The following features are noted on OCT-A22:
1) dilated bulbs on perifoveal vessels
2) dilatation of perifoveal vessels
3) vessels distorting the foveal avascular zone (FAZ)
4) bunching of vessels and
5) vascular network in the outer retina
Contrary to fundus fluorescein angiography, changes in the deep capillary plexus in the early disease and subretinal neovascularisation can be clearly observed with OCT-A (figures 16 and 17).23,24
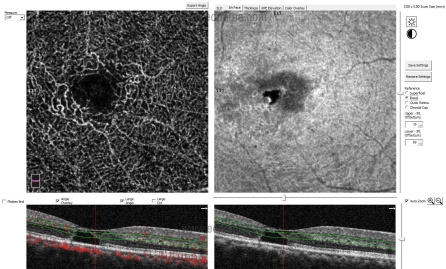
Figure 16: Identification of abnormal telangiectatic capillaries in deep capillary plexus in non-proliferative type 2 MacTel
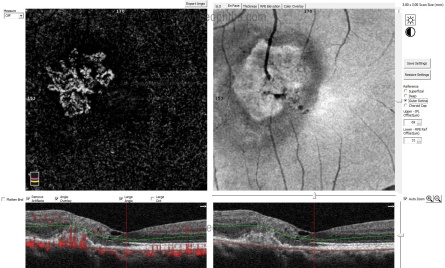
Figure 17: Identification of subretinal neovascularization in outer retina slab in proliferative type 2 MacTel
Clinical Nuggets
Useful for early detection of vascular changes in deep capillary plexus and subretinal neovascularisation in outer retina layer in type 2 MacTel.
E. Age-related Macular Degeneration:
One of the first applications of optical coherence tomography angiography was in detecting the presence of choroidal neovascularization (CNVM) in age-related macular degeneration and establishing its position in relation to the retinal pigmented epithelium and Bruch's membrane and thereby classifying the CNVM as type 1, type 2, type 3, or mixed lesions (Figure 18-20). Optical coherence tomography angiograms, due to the longer wavelength used by optical coherence tomography, show a more distinct choroidal neovascularization vascular pattern than fluorescein angiography, since there is less suffering from light scattering or is less obscured by overlying subretinal hemorrhages or exudation. Qualitative and quantitative assessments of optical coherence tomography angiography findings in exudative and nonexudative age-related macular degeneration have been largely investigated over the past 3 years both in clinical and experimental settings.25OCT-A scans can falsely identify a vascular network in the setting of geographic atrophy due to unmasking of the choroidal vasculature in the presence of RPE atrophy (Figure 21).
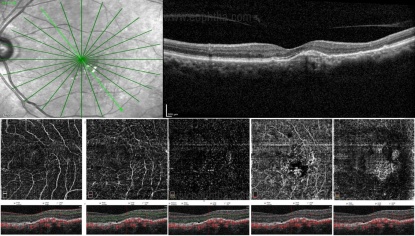
Figure 18: Identification of type 1 CNVM
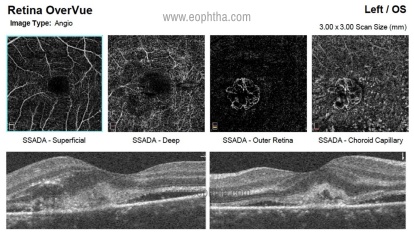
Figure 19: Identification of type 2 CNVM
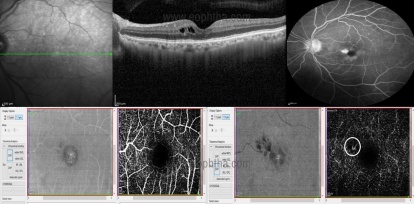
Figure 20: Identification of type 3 (retinal angiomatosis proliferans) CNVM
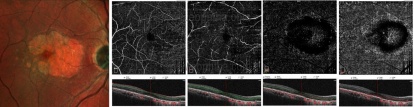
Figure 21: Unmasking artifact in the setting of geographic atrophy
Clinical Nuggets
- Unmasking artifact due to geographic atrophy
- Identification of level of abnormal neovascularisation (RAP/Subretinal/Sub RPE/ PCV)
F. Central serous chorioretinopathy (CSCR):
Especially in suspicious cases of flat and irregular PEDs, OCT-A may be helpful in the diagnosis and management of CNVM (figure 22).Although some reports mention a decreased choriocapillaris blood flow, one should pay attention to signal strength inen faceimages before interpreting this as hypoperfusion.26,27
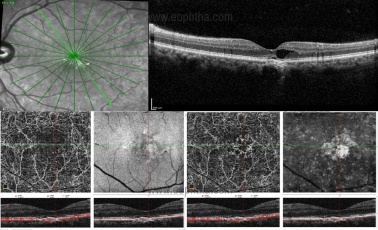
Figure 22: Identification of pachychoroid neovascularisation in a case with chronic CSCR
G. Absence/reduction of foveal avascular zone (FAZ) area:
In cases such as high myopia, posterior microphthalmos, albinism, and isolated foveal hypoplasia, there is loss of foveal contour with the persistence of inner retinal layers at the fovea.28–30 This leads to the identification of vascular architecture at the fovea which is identified as reduction or absence of FAZ (Figure 23).
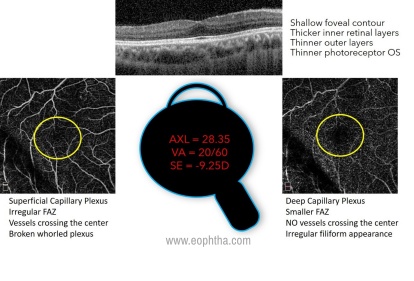
Figure 23: Reduction of FAZ in a patient with high myopia
Limitations of OCT-angiography:
- As a light source-dependent device, media opacities can lead to signal attenuation and shadowing artifact.
- Imaging the peripheral retina may not be possible due to the limited area of visualization (3mm2to 12mm2).
- As the area of visualization increases, resolution drops markedly in order to keep scanning time acceptable.
- OCT-A detects "motion", and thus very low amounts of blood flow or very rapid blood flow beyond the device threshold may be undetected.13
Conclusion:
OCT-A provides useful information on the microvascular network by detecting the changes in OCT signals due to moving red blood cells without the need for intravenous dye injection or biopsy. But this is possible, only if
-
- media clarity is good
- eye fixation is good
- there are no media opacities
- retinal thickness is uniform and the segmentation is accurate
- there is no intra/subretinal fluid
- there are no overlying structural findings like hemorrhage, hard exudates or pigment plaques and
- there is a corresponding OCT B scan is available to correlate
References:
1. Fingler J, Readhead C, Schwartz DM, et al. Phase-contrast OCT imaging of transverse flows in the mouse retina and choroid. Invest Ophthalmol Vis Sci 2008; 49: 5055–5059.
2. Koustenis A, Harris A, Gross J, et al. Optical coherence tomography angiography: an overview of the technology and an assessment of applications for clinical research. Br J Ophthalmol 2017; 101: 16–20.
3. Stone J, van Driel D, Valter K, et al. The locations of mitochondria in mammalian photoreceptors: relation to retinal vasculature. Brain Res 2008; 1189: 58–69.
4. Provis JM. Development of the primate retinal vasculature. Prog Retin Eye Res 2001; 20: 799–821.
5. Snodderly DM, Weinhaus RS, Choi JC. Neural-vascular relationships in central retina of macaque monkeys (Macaca fascicularis). J Neurosci Off J Soc Neurosci 1992; 12: 1169–1193.
6. Henkind P. Radial peripapillary capillaries of the retina. I. Anatomy: human and comparative. Br J Ophthalmol 1967; 51: 115–123.
7. Alterman M, Henkind P. Radial peripapillary capillaries of the retina. II. Possible role in Bjerrum scotoma. Br J Ophthalmol 1968; 52: 26–31.
8. Clinical Anatomy and Physiology of the Visual System. Elsevier. Epub ahead of print 2012. DOI: 10.1016/C2009-0-56108-9.
9. Gorczynska I, Migacz JV, Zawadzki RJ, et al. Comparison of amplitude-decorrelation, speckle-variance and phase-variance OCT angiography methods for imaging the human retina and choroid. Biomed Opt Express 2016; 7: 911–942.
10.Conti FF, Young JM, Silva FQ, et al. Repeatability of Split-Spectrum Amplitude-Decorrelation Angiography to Assess Capillary Perfusion Density Within Optical Coherence Tomography. Ophthalmic Surg Lasers Imaging Retina 2018; 49: e9–e19.
11. Jia Y, Tan O, Tokayer J, et al. Split-spectrum amplitude-decorrelation angiography with optical coherence tomography. Opt Express 2012; 20: 4710–4725.
12. Tokayer J, Jia Y, Dhalla A-H, et al. Blood flow velocity quantification using split-spectrum amplitude-decorrelation angiography with optical coherence tomography. Biomed Opt Express 2013; 4: 1909–1924.
13. Hua R, Wang H. Dark Signals in the Choroidal Vasculature on Optical Coherence Tomography Angiography: An Artefact or Not? J Ophthalmol 2017; 2017: 1–8.
14. Munk MR, Giannakaki-Zimmermann H, Berger L, et al. OCT-angiography: A qualitative and quantitative comparison of 4 OCT-A devices. PLOS ONE 2017; 12: e0177059.
15. Spaide RF, Fujimoto JG, Waheed NK. IMAGE ARTIFACTS IN OPTICAL COHERENCE TOMOGRAPHY ANGIOGRAPHY. Retina Phila Pa 2015; 35: 2163–2180.
16. Chen FK, Viljoen RD, Bukowska DM. Classification of image artefacts in optical coherence tomography angiography of the choroid in macular diseases. Clin Experiment Ophthalmol 2016; 44: 388–399.
17.Enders C, Lang GE, Dreyhaupt J, et al. Quantity and quality of image artifacts in optical coherence tomography angiography. PloS One 2019; 14: e0210505.
18. Khadamy J, Abri Aghdam K, Falavarjani KG. An Update on Optical Coherence Tomography Angiography in Diabetic Retinopathy. J Ophthalmic Vis Res 2018; 13: 487–497.
19. Tey KY, Teo K, Tan ACS, et al. Optical coherence tomography angiography in diabetic retinopathy: a review of current applications. Eye Vis 2019; 6: 37.
20. Yang S, Liu X, Li H, et al. Optical coherence tomography angiography characteristics of acute retinal arterial occlusion. BMC Ophthalmol 2019; 19: 147.
21. Tsai G, Banaee T, Conti FF, et al. Optical Coherence Tomography Angiography in Eyes with Retinal Vein Occlusion. J Ophthalmic Vis Res 2018; 13: 315–332.
22. Saoji K, Pathengay A, Chhablani J, et al. Response to anti-vascular endothelial growth factor of abnormal retinal vascular net in para foveal telangiectasia group II images on optical coherence tomography-angiography. Indian J Ophthalmol 2019; 67: 105–108.
23. Nalcı H, Şermet F, Demirel S, et al. Optical Coherence Tomography Angiography Findings in Type-2 Macular Telangiectasia. Turk J Ophthalmol 2017; 47: 279–284.
24. Chidambara L, Gadde SGK, Yadav NK, et al. Characteristics and quantification of vascular changes in macular telangiectasia type 2 on optical coherence tomography angiography. Br J Ophthalmol 2016; 100: 1482–1488.
25. Lupidi M, Cerquaglia A, Chhablani J, et al. Optical coherence tomography angiography in age-related macular degeneration: The game changer. Eur J Ophthalmol 2018; 28: 349–357.
26. Chan SY, Wang Q, Wei WB, et al. OPTICAL COHERENCE TOMOGRAPHIC ANGIOGRAPHY IN CENTRAL SEROUS CHORIORETINOPATHY. Retina Phila Pa 2016; 36: 2051–2058.
27. Cakir B, Reich M, Lang S, et al. OCT Angiography of the Choriocapillaris in Central Serous Chorioretinopathy: A Quantitative Subgroup Analysis. Ophthalmol Ther 2019; 8: 75–86.
28. Venkatesh R, Sinha S, Gangadharaiah D, et al. Retinal structural-vascular-functional relationship using optical coherence tomography and optical coherence tomography - angiography in myopia. Eye Vis Lond Engl 2019; 6: 8.
29.Venkatesh R, Jain K, Srinivasan P, et al. Retinal structural and vascular changes in posterior microphthalmos. Clin Exp Optom 2020; 103: 634–640.
30. Venkatesh R, Jain K, Yadav NK. Multicolour imaging in isolated foveal hypoplasia. Indian J Ophthalmol 2020; 68: 191–192.