

Multicolor imaging (MCI) is a non-invasive retinal imaging modality available in the Spectralis platform (Heidelberg Engineering, Heidelberg, Germany). It simultaneously acquires three reflectance images of the retina using three individual lasers of different wavelengths: blue (488 nm), green (515 nm), and infrared (820 nm). These penetrate the tissue to different depths, simultaneously capturing and depicting information originating from different retinal structures. The infrared reflectance (IR) image visualizes structures at the level of the outer retina and choroid. The green reflectance (GR) image allows imaging of retinal blood vessels, hemorrhages, and exudates. The blue reflectance (BR) particularly provides details of the inner retina and the vitreoretinal interface such as epiretinal membranes, retinal nerve fiber layer (RNFL) thinning, and macular pigment changes. The information from these three images is integrated to form a composite multicolor image.1
Color fundus photography (CFP) is currently the most commonly used fundus photographic modality. CFP utilizes a broad spectrum of illumination and it is the imaging modality that best correlates with clinical ophthalmoscopy.1 However it has various limitations. It uses bright white light and needs dilated pupil, thus making it uncomfortable for patients. It is difficult to obtain good images in presence of media opacities. The images obtained have low contrast and lesion margins are not well delineated. MCI has the inherent advantages of much superior confocal scanning technology. Confocal technology results in a sharp image with higher resolution and contrast. Inbuilt live eye-tracking technology and “noise” reduction techniques enhance image stability and clarity. 2 Other advantages include small pupil scanning and avoidance of discomforting white light, as used to obtain CFP. Other unique advantage of this modality is the completion of all scan acquisitions in a single machine and utilization of the rescan follow-up mode of the Spectralis platform for patients having multiple image acquisition at multiple time points.1 Multicolor image can be captured with both 30° and 55° field of view along with three reflectance images (BR, GR, and IR). Herein, we describe the utility of MCI in the various retinal, choroid, and optic nerve head disorders.
Retinal disorders:
Diabetic retinopathy
Early detection of diabetic retinopathy through screening programs and subsequent referral for therapy is vital to preserving vision in individuals with diabetes. Screening for retinopathy is undertaken using conventional CFP and relies on the identification of hemorrhages, hard exudates, and cotton-wool spots. In a study by Roy et al, they found out that hard exudates, cotton wool spots, and retinal hemorrhages were better seen on MCI and in GR images as compared to CFP, BR, and infrared imaging, respectively (Figs 1 and 2).The sensitivity and specificity of MCI to detect these lesions were more than 90% with CFP as the comparator.3 On a multicolor composite image, microaneurysms are seen as dark red dots, hard exudates as greenish-yellow, and cotton wool spots as greenish-white. MCI is a useful technique to detect different subtypes of retinal microaneurysms in diabetic retinopathy.4 In proliferative diabetic retinopathy, MCI can easily detect subtle neovascularization which may be missed on CFP. The fibrovascular nature of neovascularization is seen better on MCI than CFP (Fig 3). Green reflectance highlights both vascular and fibrous components of neovascularization.5 In a study by Saurabh et al, MCI was superior to CFP in detecting cysts of diabetic macular edema at fovea.6 It can also be used to monitor the progress of diabetic retinopathy.7
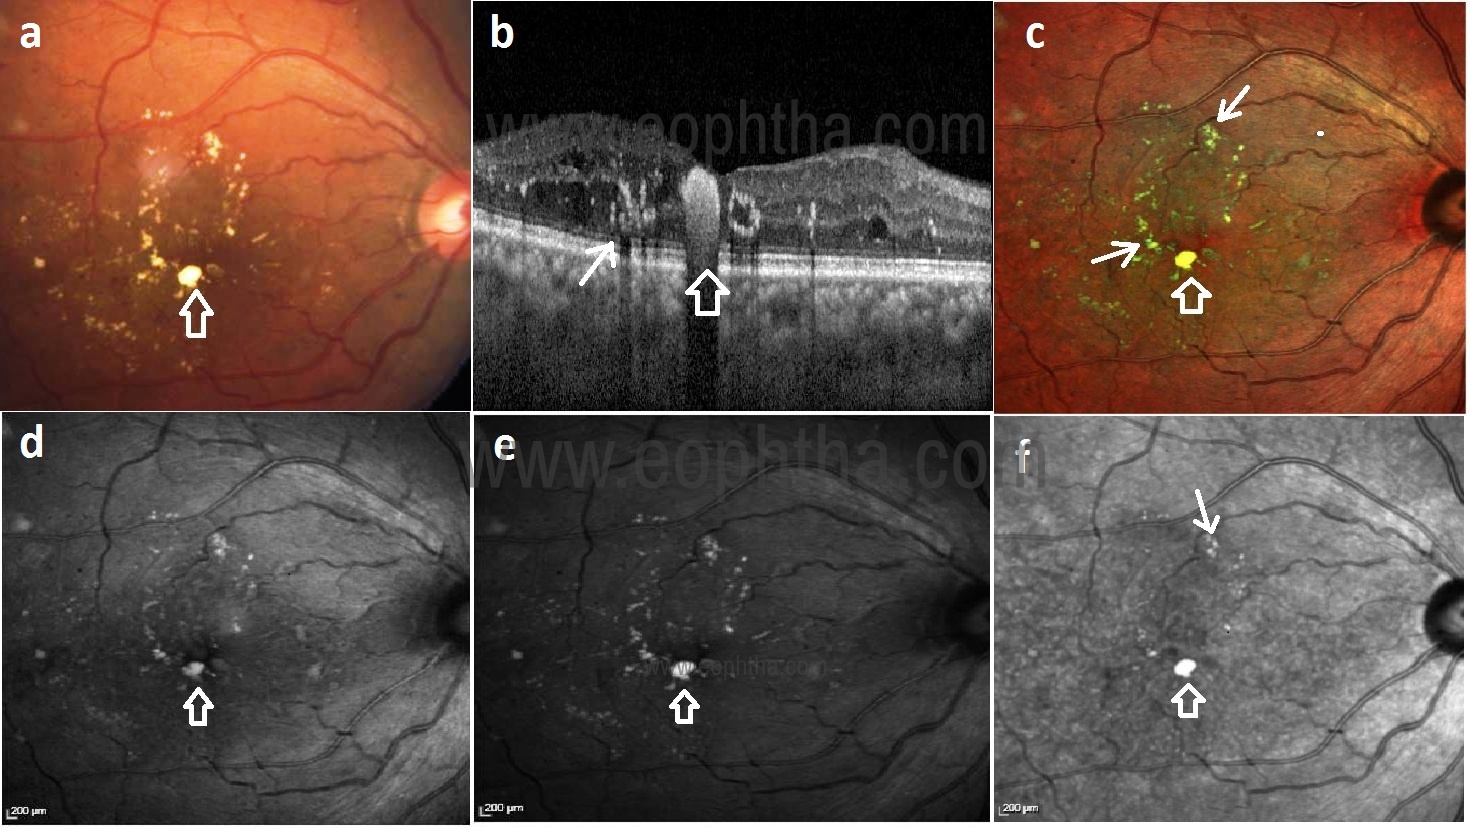
Fig 1: Color fundus photograph (CFP) (a) shows yellowish hard exudates (HEX) at the macula. SDOCT (b) shows HEX plaque as a hyperreflective zone with a posterior shadow. Multicolor imaging (MCI) (c) shows multiple greenish-yellow HEX. HEX are better visualized in green reflectance (GR) (e) image as compared to blue reflectance (BR) (d) and infrared reflectance (IR) (f) images.
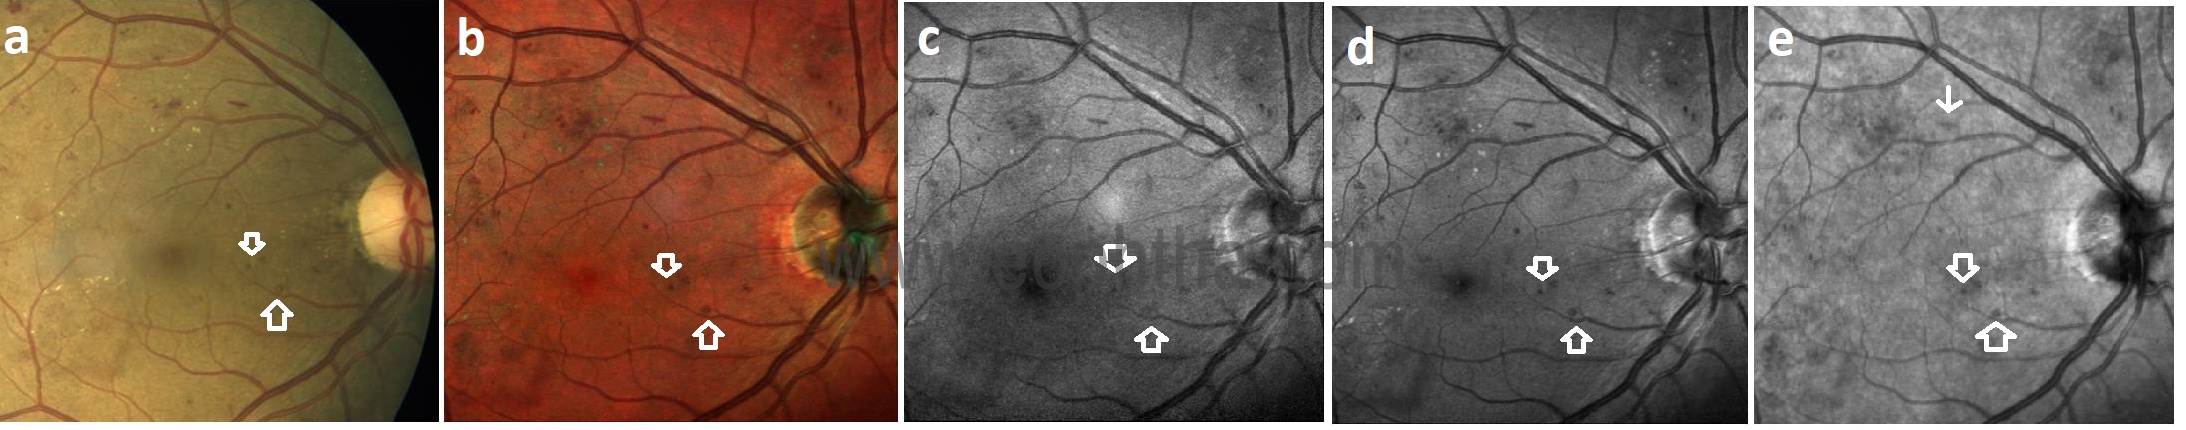
Fig 2: MCI (b) shows retinal hemorrhages that appear darker compared to CFP (a). Retinal hemorrhages are better defined in GR (d) image as compared to BR (c) and IR (e) images.
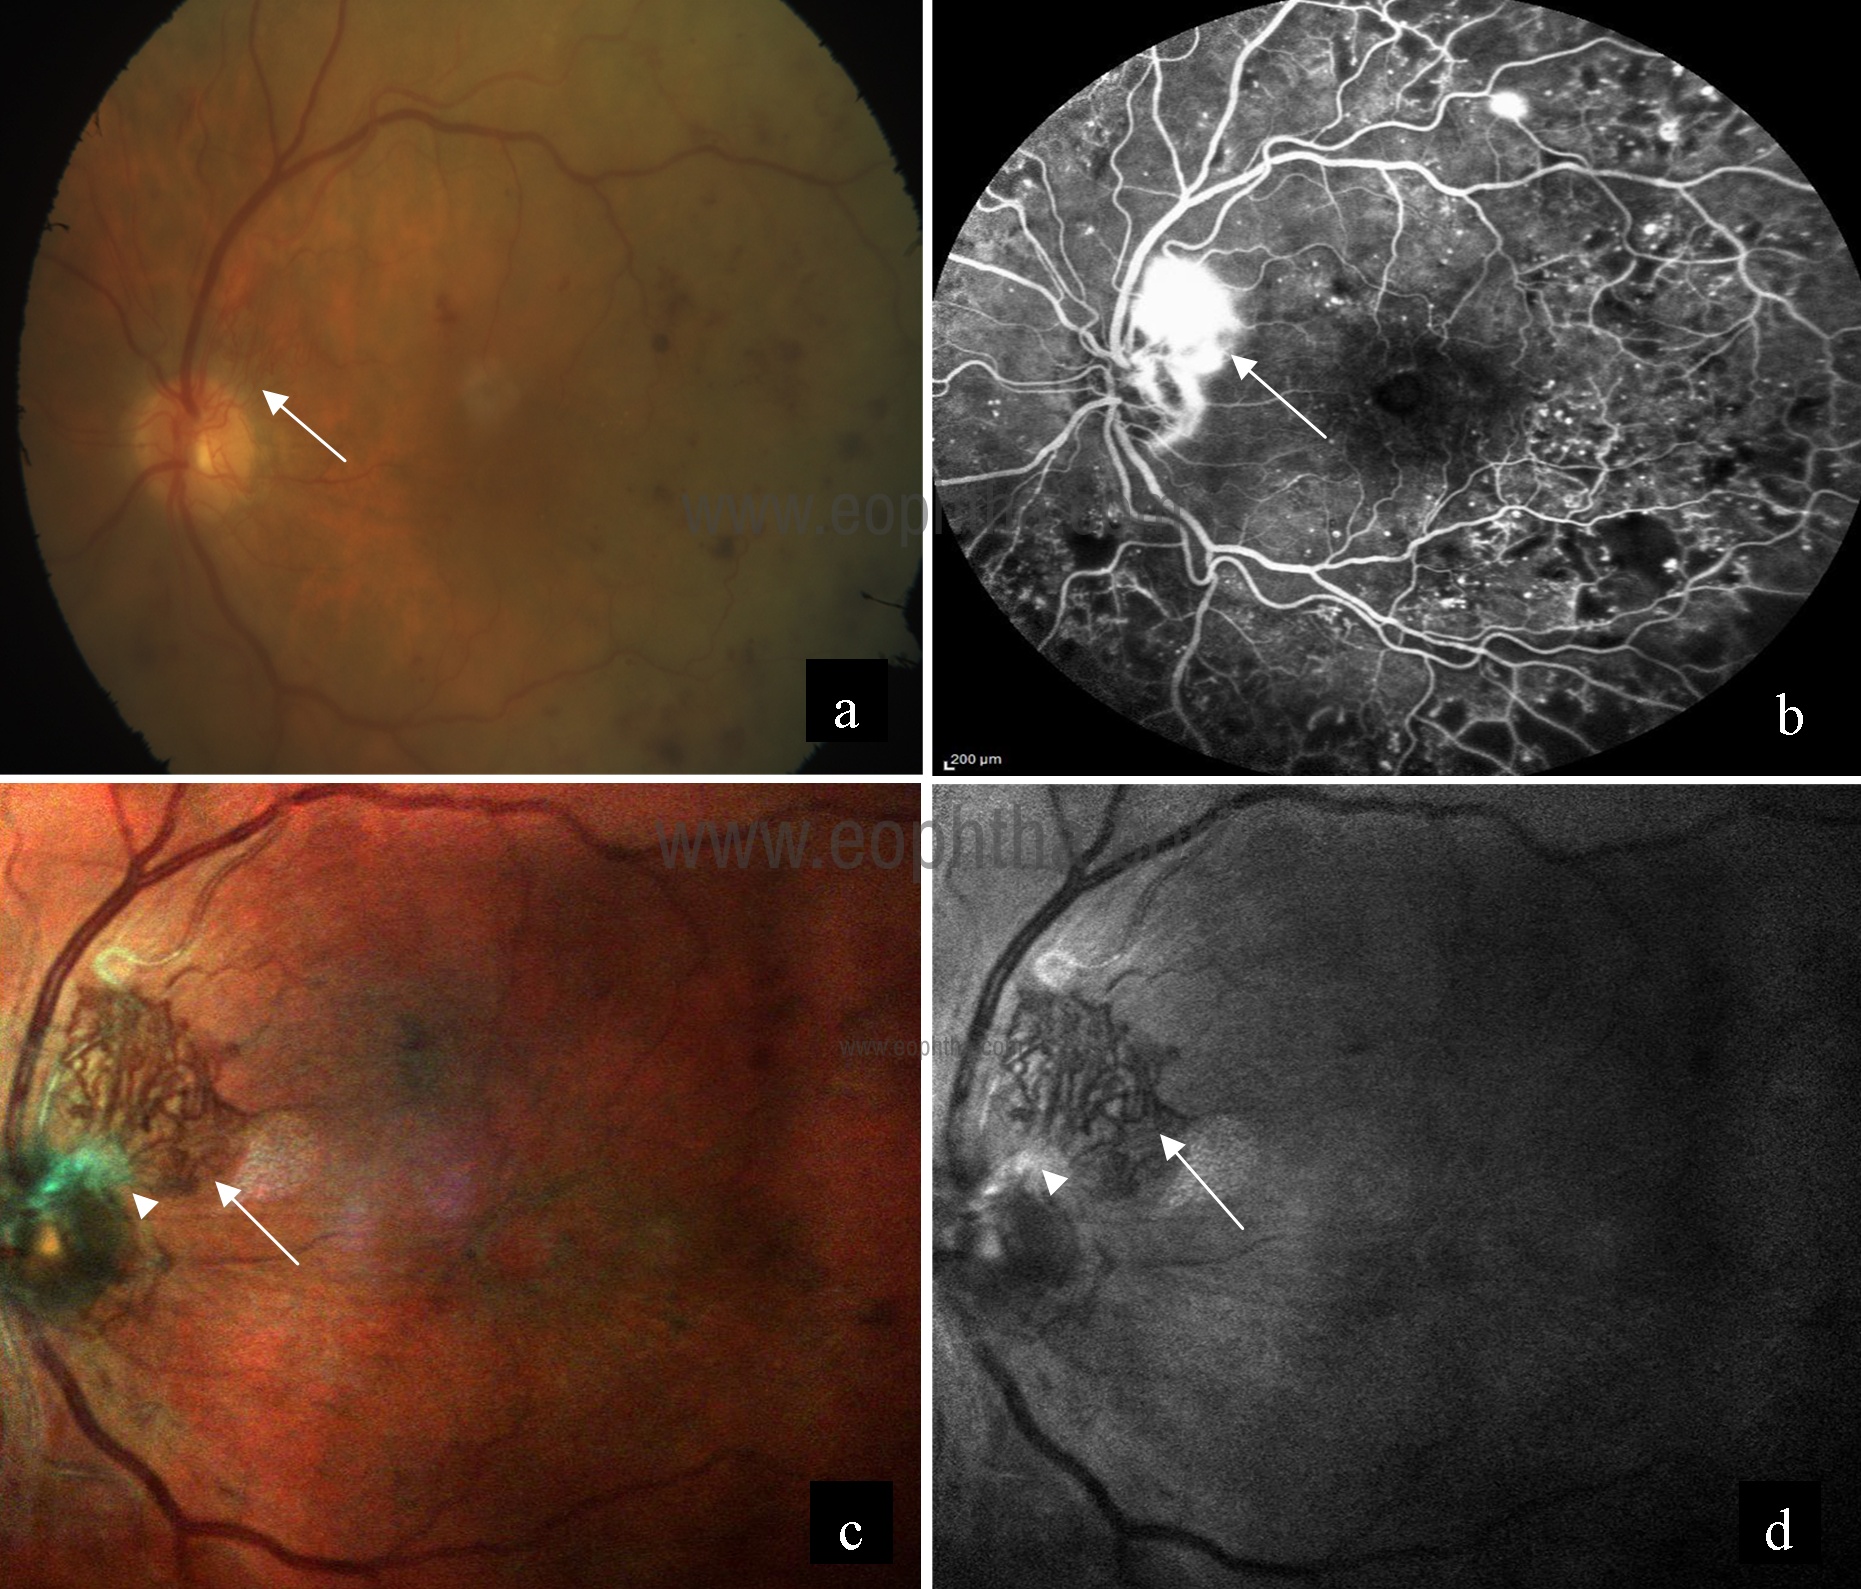
Fig 3: Neovascularization on the superior disc margin was visible in the color fundus photography of the left eye (a). Fundus fluorescein angiography showed leakage from NVD with multiple leaking microaneurysms (b).However, when MCI is used, the fibrovascular nature of the neovascularization was seen in much greater detail – this “tuft” is much more complex and extensive when seen with MCI than seen with color fundus photography (c). Green reflectance also provides clear evidence of both the vascular and fibrous components of this NVD (d).
Retinal vascular occlusion
Retinal vascular occlusions can visual loss when associated with macular edema and neovascularization. MCI can detect subtle macular edema and retinal thickening. Macular edema is seen as a greenish tinge8 (Fig 4). The area of ischemia and hemorrhages are well visualized. MCI allows documentation of disease progression and the response to treatment. In a study by Schouten et al, they have described the role of MCI, particularly the BR component in the diagnosis of concurrent macular telangiectasia type 2 and branch retinal vein occlusion.9 It helps in guiding treatment decisions and prognosticating treatment outcomes.
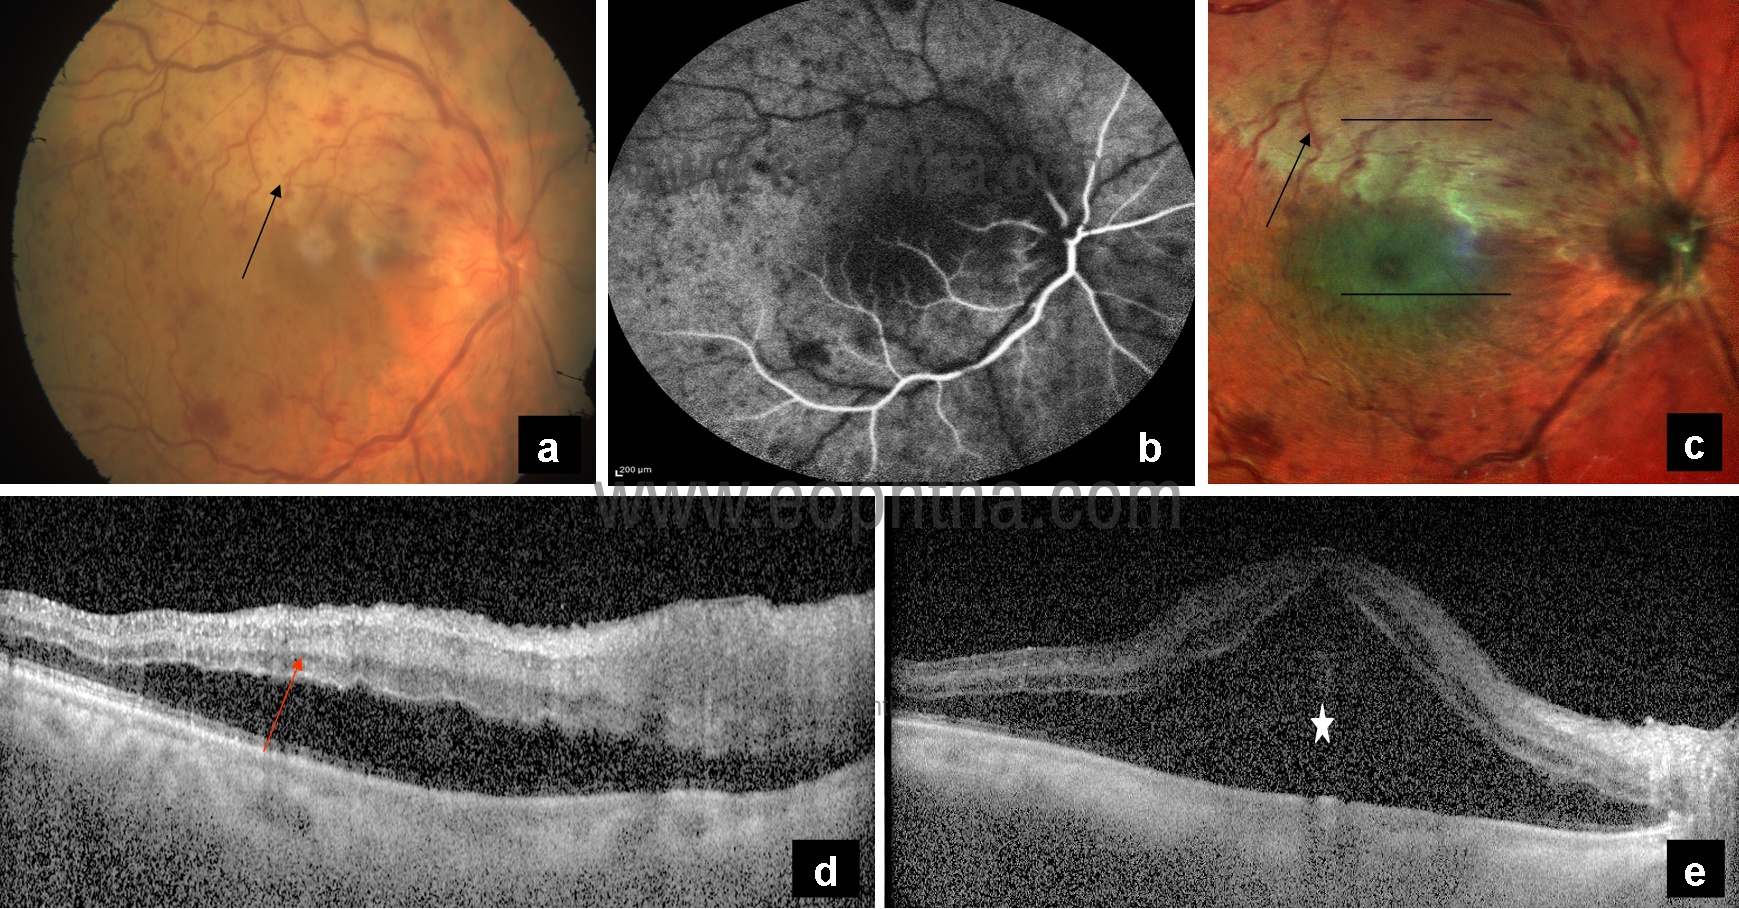
Fig 4: CFP (a) showing multiple hemorrhages, disc edema, and pale ischemic area superiorly (black arrow). Fundus fluorescein angiography (b) showing delayed arterial dye filling and prolonged arteriovenous transit time. MCI (c) highlighting the area of ischemia (black arrow) and showing greenish tinge in the area of macular edema (white arrow). OCT showing hyperreflectivity of inner retinal layers (d) (red arrow) and an increase in retinal thickness (e) in the corresponding areas.
Age-related macular degeneration
Age-related macular degeneration (AMD) is a common macular disorder affecting elderly people. It is characterized by the presence of drusen in the macula that can be complicated by choroidal neovascularization (CNV) or geographic atrophy (GA). MCI is an excellent tool for the measurement of area and width of GA and for the detection of foveal sparing.10 GA is best visualized on IR images. Refractile drusen are seen in association with AMD and are thought to be an important prognostic biomarker for developing central GA.11 In multicolor composite image, soft drusen appear green with orange borders, while reticular drusen stand out as glistening, light yellow structures (Figs 5a-5d). Refractile drusen are distinctly hyper‑reflectant in GR and BR, whereas soft drusen appear mildly hyper‑reflectant (Figs 5e-5i). Reticular pseudodrusen may represent a high-risk phenotypic feature for progression, can also be imaged more distinctly on a multicolor image.12 Reticular pseudodrusen can be distinguished from drusen on the basis of its appearance and identification on the GR images. Soft sub‑RPE drusen are highlighted well on IR images.13 MCI allows earlier detection of CNV and helps in monitoring during anti-VEGF therapy. CNV appears greenish on MCI (Fig 6).
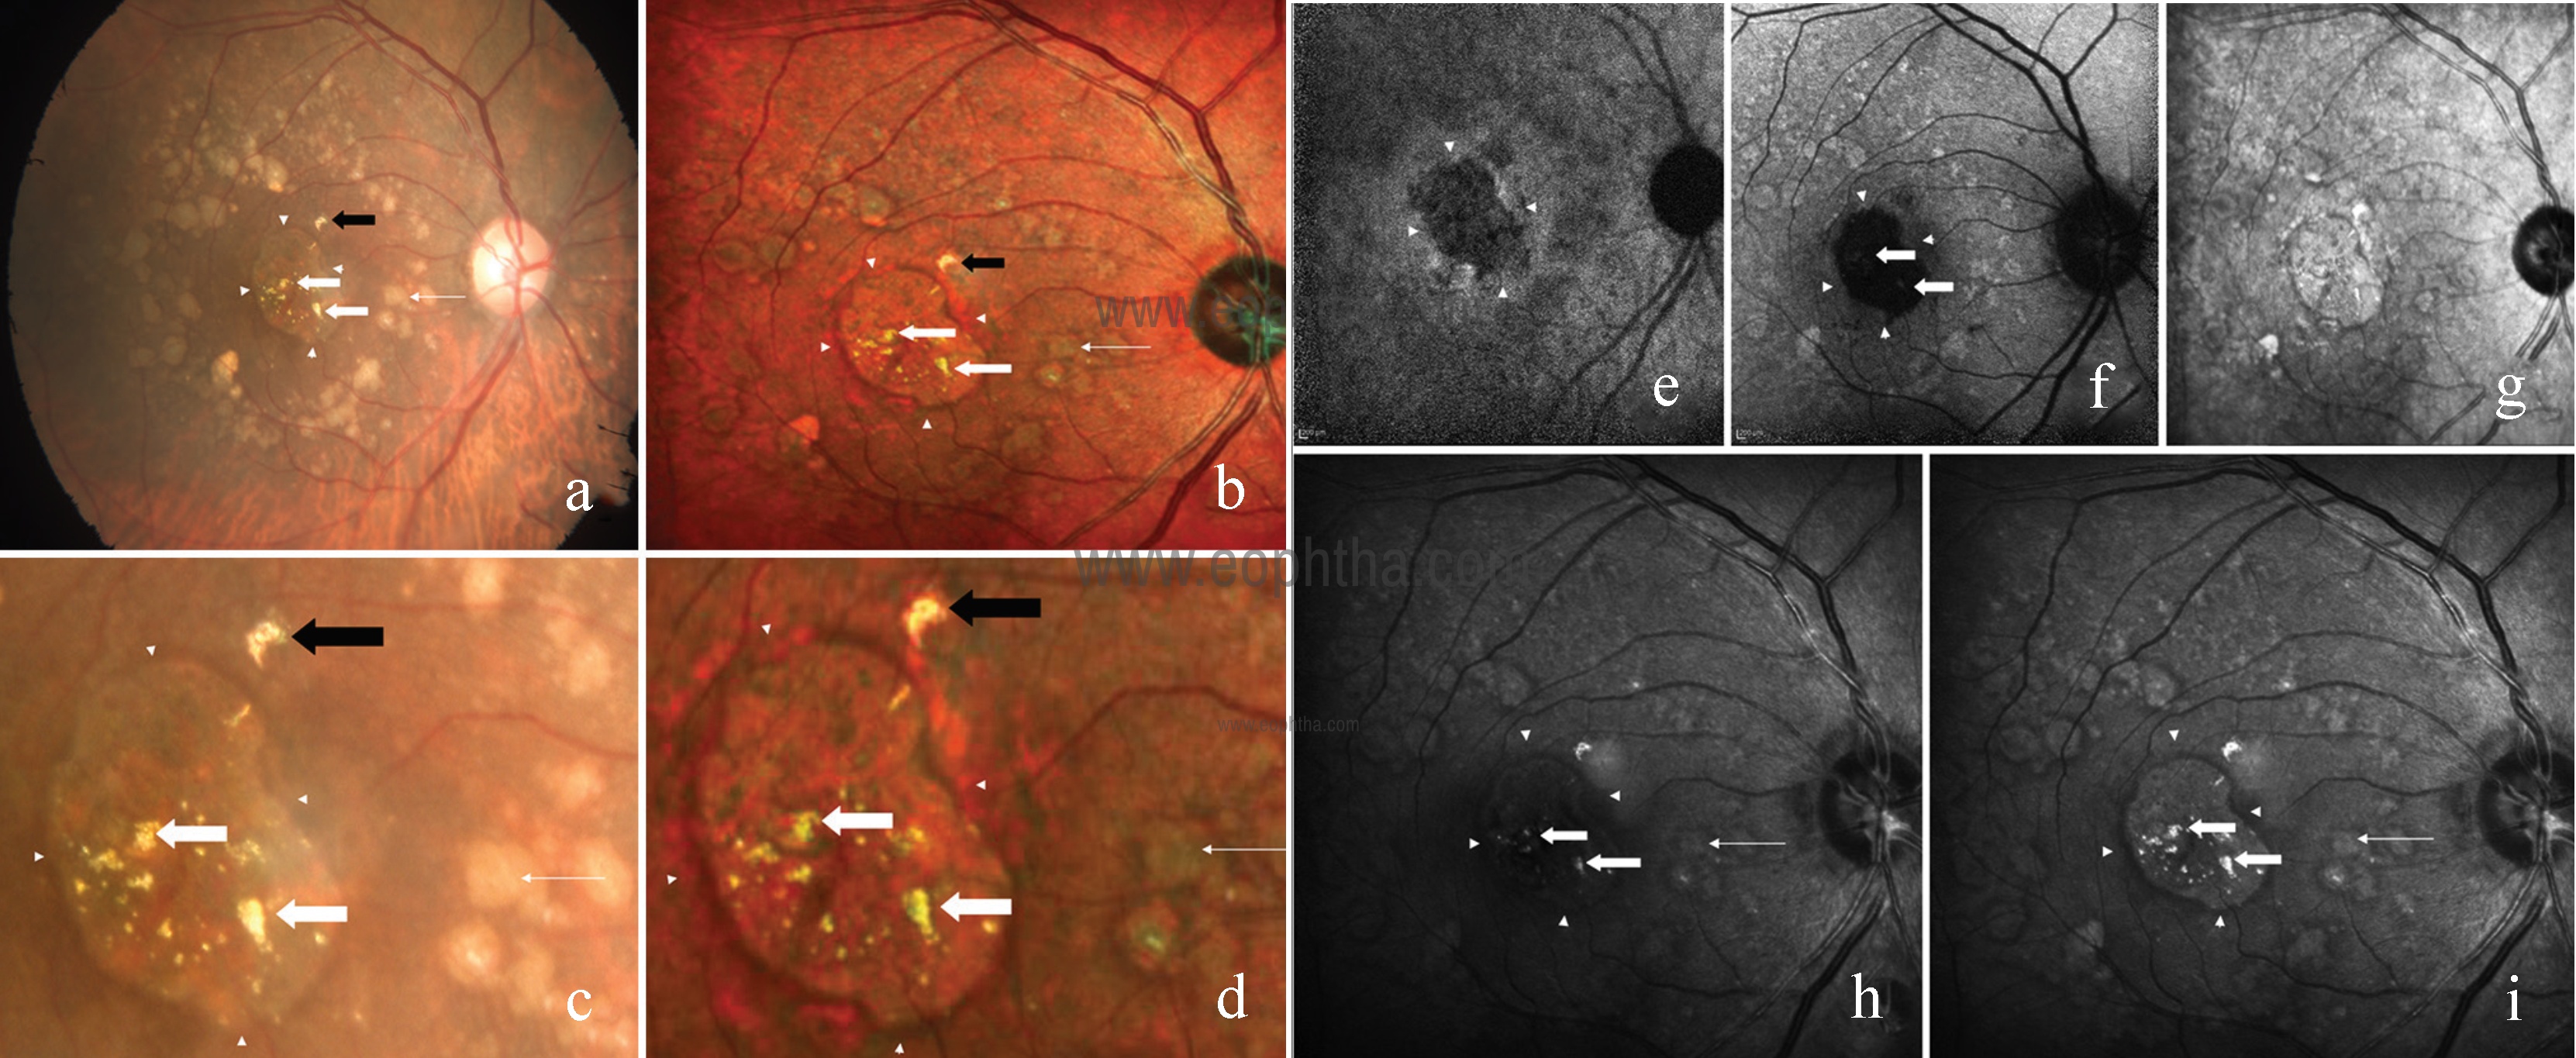
Fig 5: CFP (a) of the right eye showing refractile drusen as yellow, glistening deposits in the macular and perimacular area (thick white arrow), and soft drusen circumferentially (thin white arrow) with an area of central retinal pigment epithelium atrophy (arrowhead). Hyper-reflectant structure seen superonasal to the fovea is artifactual (black arrow). Multicolor composite image (b) highlights the refractile drusen as small, yellow, glistening deposits (thick white arrow), whereas soft drusen appear as green with an orange border (thin white arrow). Magnified conventional fundus photography (c) and multicolor composite image (d) view of refractile drusen (thick white arrow), soft drusen (thin white arrow), and artifact (black arrow). Near-infrared autofluorescence (e) and blue autofluorescence (f) highlight the area of retinal pigment epithelium atrophy. IR (g) fails to highlight the drusen. BR (h) shows refractile drusen as hyper-reflectant lesions (thick white arrow). Soft drusen appear mildly hyper-reflectant with surrounding dark borders (thin white arrow). Arrowhead shows the area of retinal pigment epithelium atrophy. GR (i) distinctly highlights the refractile drusen as hyper-reflectant material (thick white arrow), whereas soft drusen as mildly hyper-reflectant with dark borders (thin white arrow) surrounding it with distinct retinal pigment epithelium atrophic area (arrowheads).
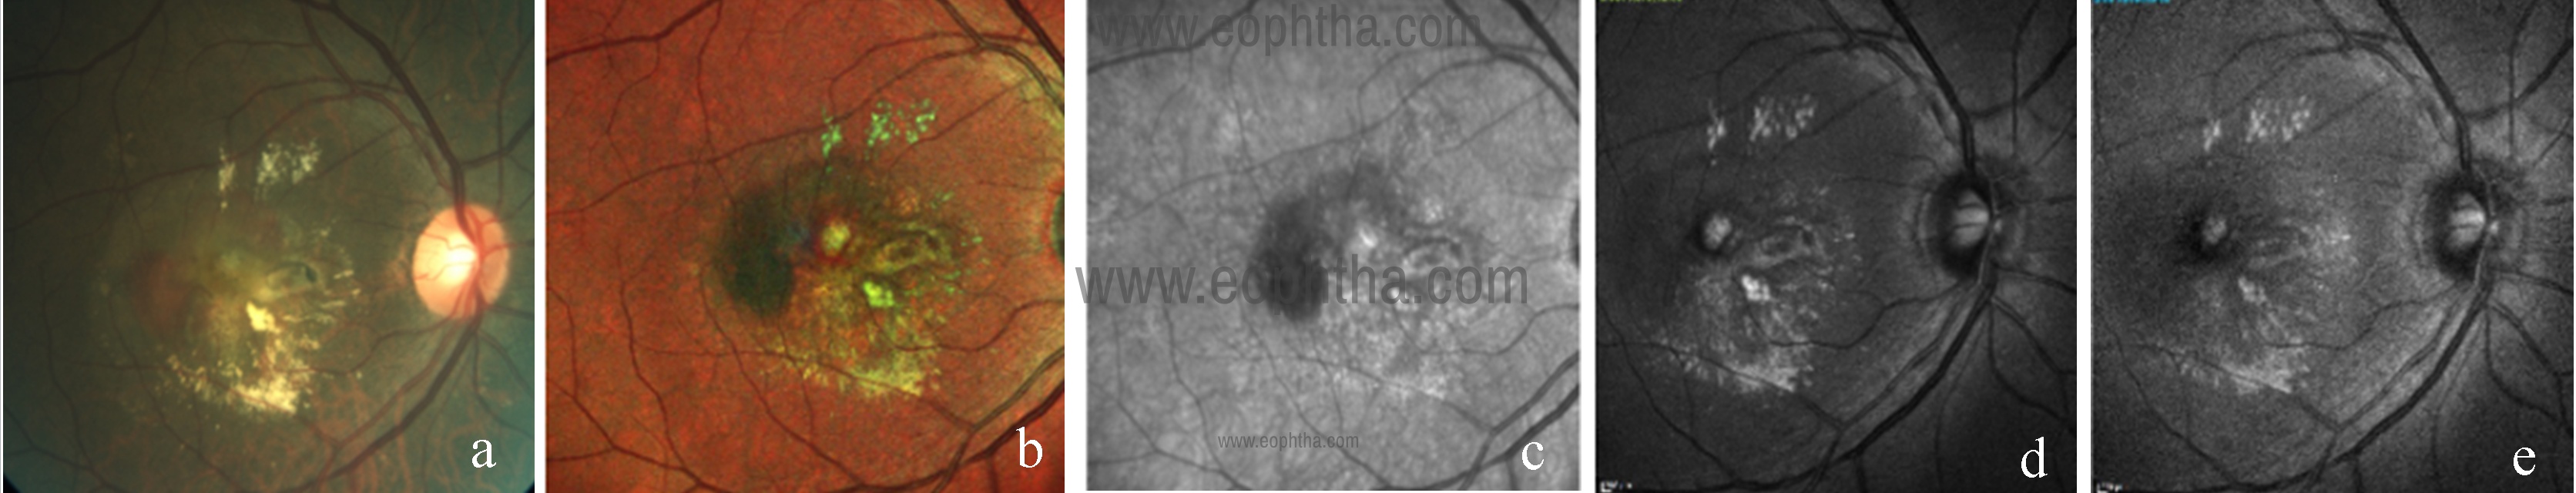
Fig 6: CFP (a) of the right eye showing greyish-white membrane with yellow hard exudates at macula suggestive of CNV. Multicolor composite image (b) highlights the area of CNV as greenish tinge with greenish-yellow hard exudates with corresponding IR (c), GR (d), and BR (e) images.
Polypoidal choroidal vasculopathy
Accurate diagnosis of Polypoidal choroidal vasculopathy (PCV) is important because the clinical course of PCV differs from that of typical neovascular AMD and treatment options are different. Orange subretinal nodules or massive submacular hemorrhage is highly suggestive of PCV. Multicolor imaging is able to detect polypoidal lesions in most patients with PCV.14 Both the polyps and branching vascular network (BVN) are best visualized using the multicolor composite or infrared reflectance image as the lesions are located beneath the retinal pigment epithelium (RPE).15 Polyps appear as dark green oval lesions on multicolor composite image and BVN appear as mottled gray regions on IR. Associated pigment epithelial detachment (PED) and subretinal hemorrhage are also well visualized.
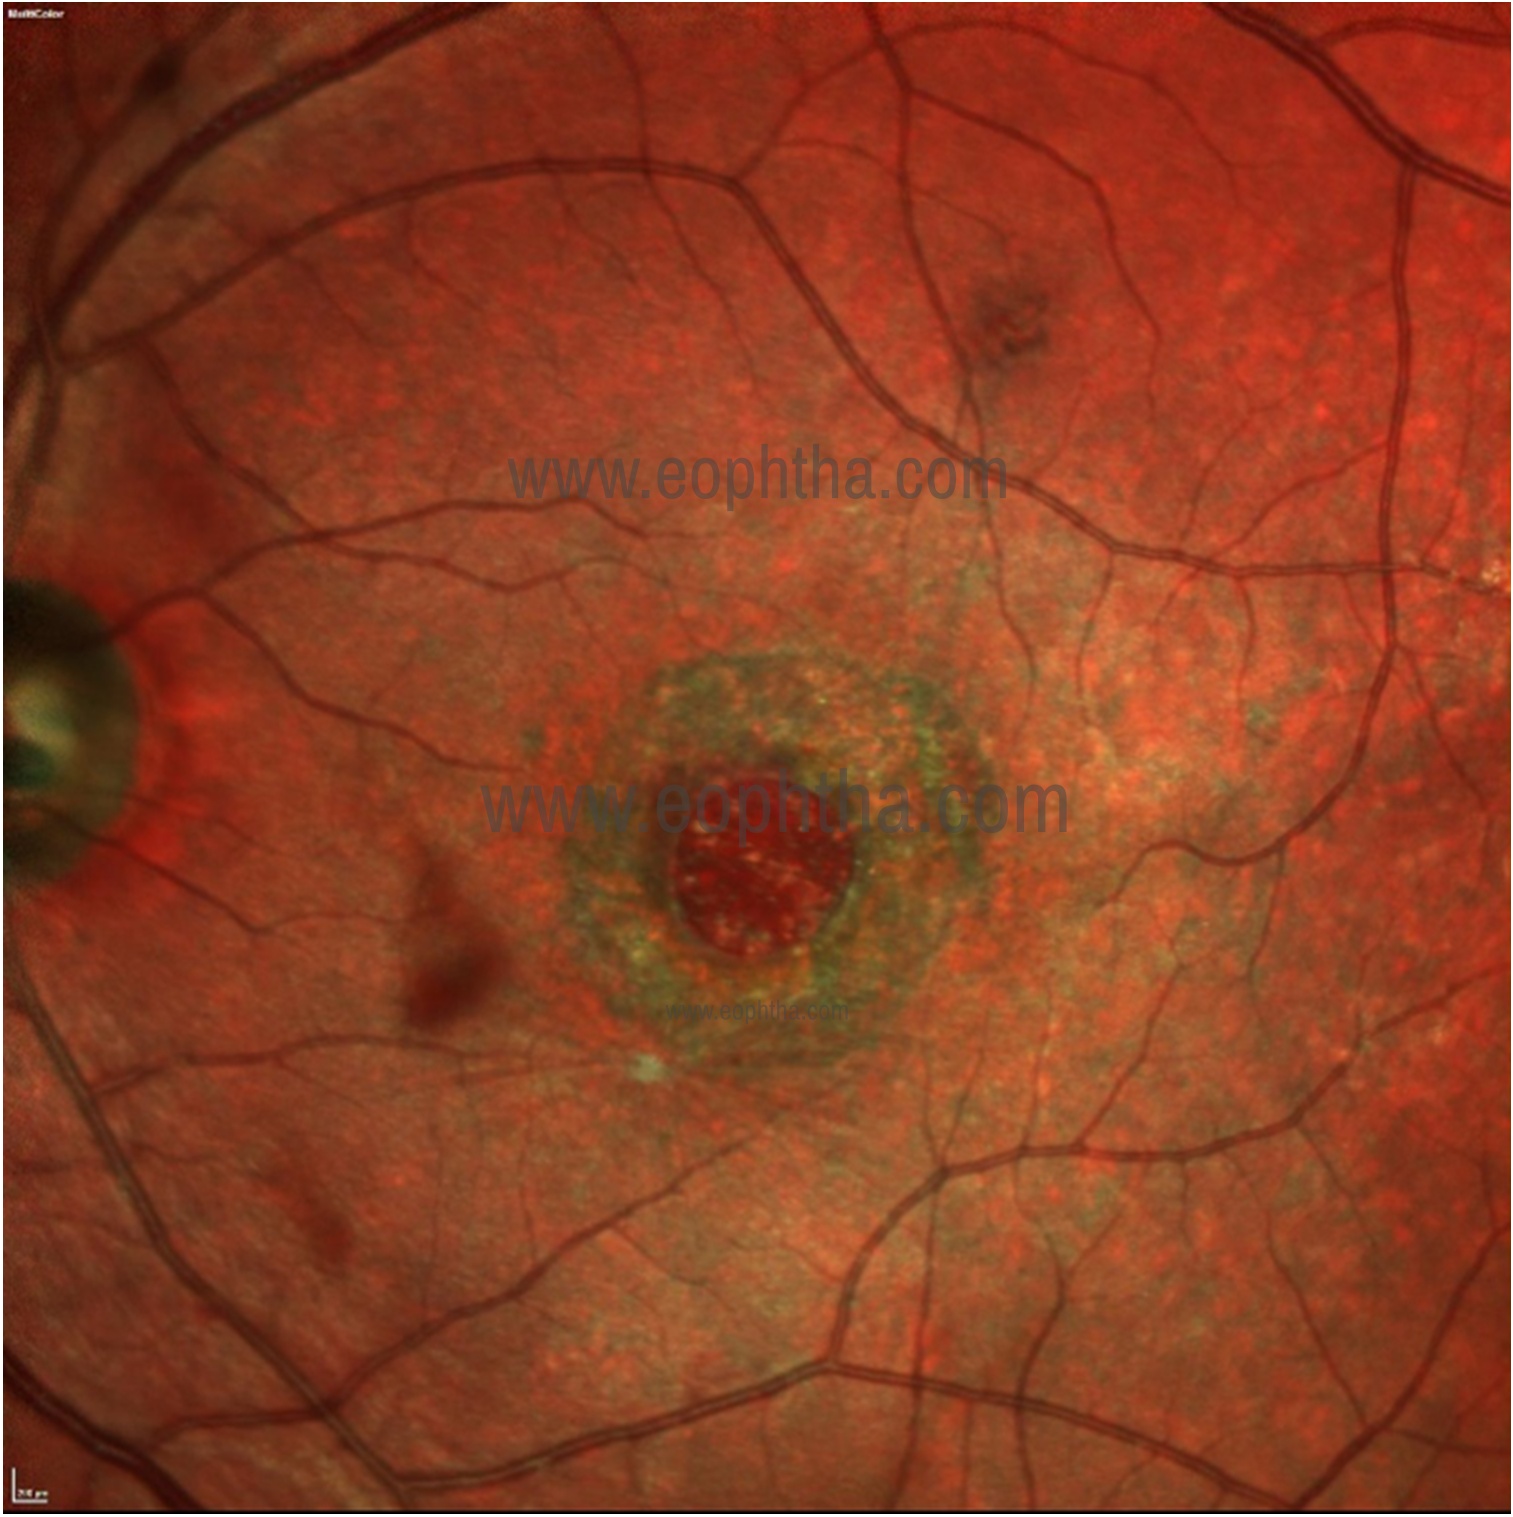
Figure 7: Multicolour composite image of the left eye showing a full-thickness macular home with the surrounding cuff of subretinal fluid that is seen as greenish tinge.
Macular hole
A macular hole (Figure 7) is well visualized on MCI. Surrounding cuff of subretinal fluid is seen as greenish tinge. Associated RPE atrophy can be seen. Delineation of margin and detection of subretinal fluid (SRF) is better than CFP. MCI is capable of detecting inner retinal alterations in patients with a history of internal limiting membrane (ILM) peeling, and may be clinically useful for monitoring anatomical changes associated with ILM peeling.16 Dissociated optic nerve fiber layer (DONFL) is an after effect of ILM peeling for macular hole repair that is usually diagnosed on Spectral domain optical coherence tomography (SD-OCT).17 DONFL is seen as darker arcuate zones on multicolour composite image. BR image delineates the DONFL better than GR (Fig 8).
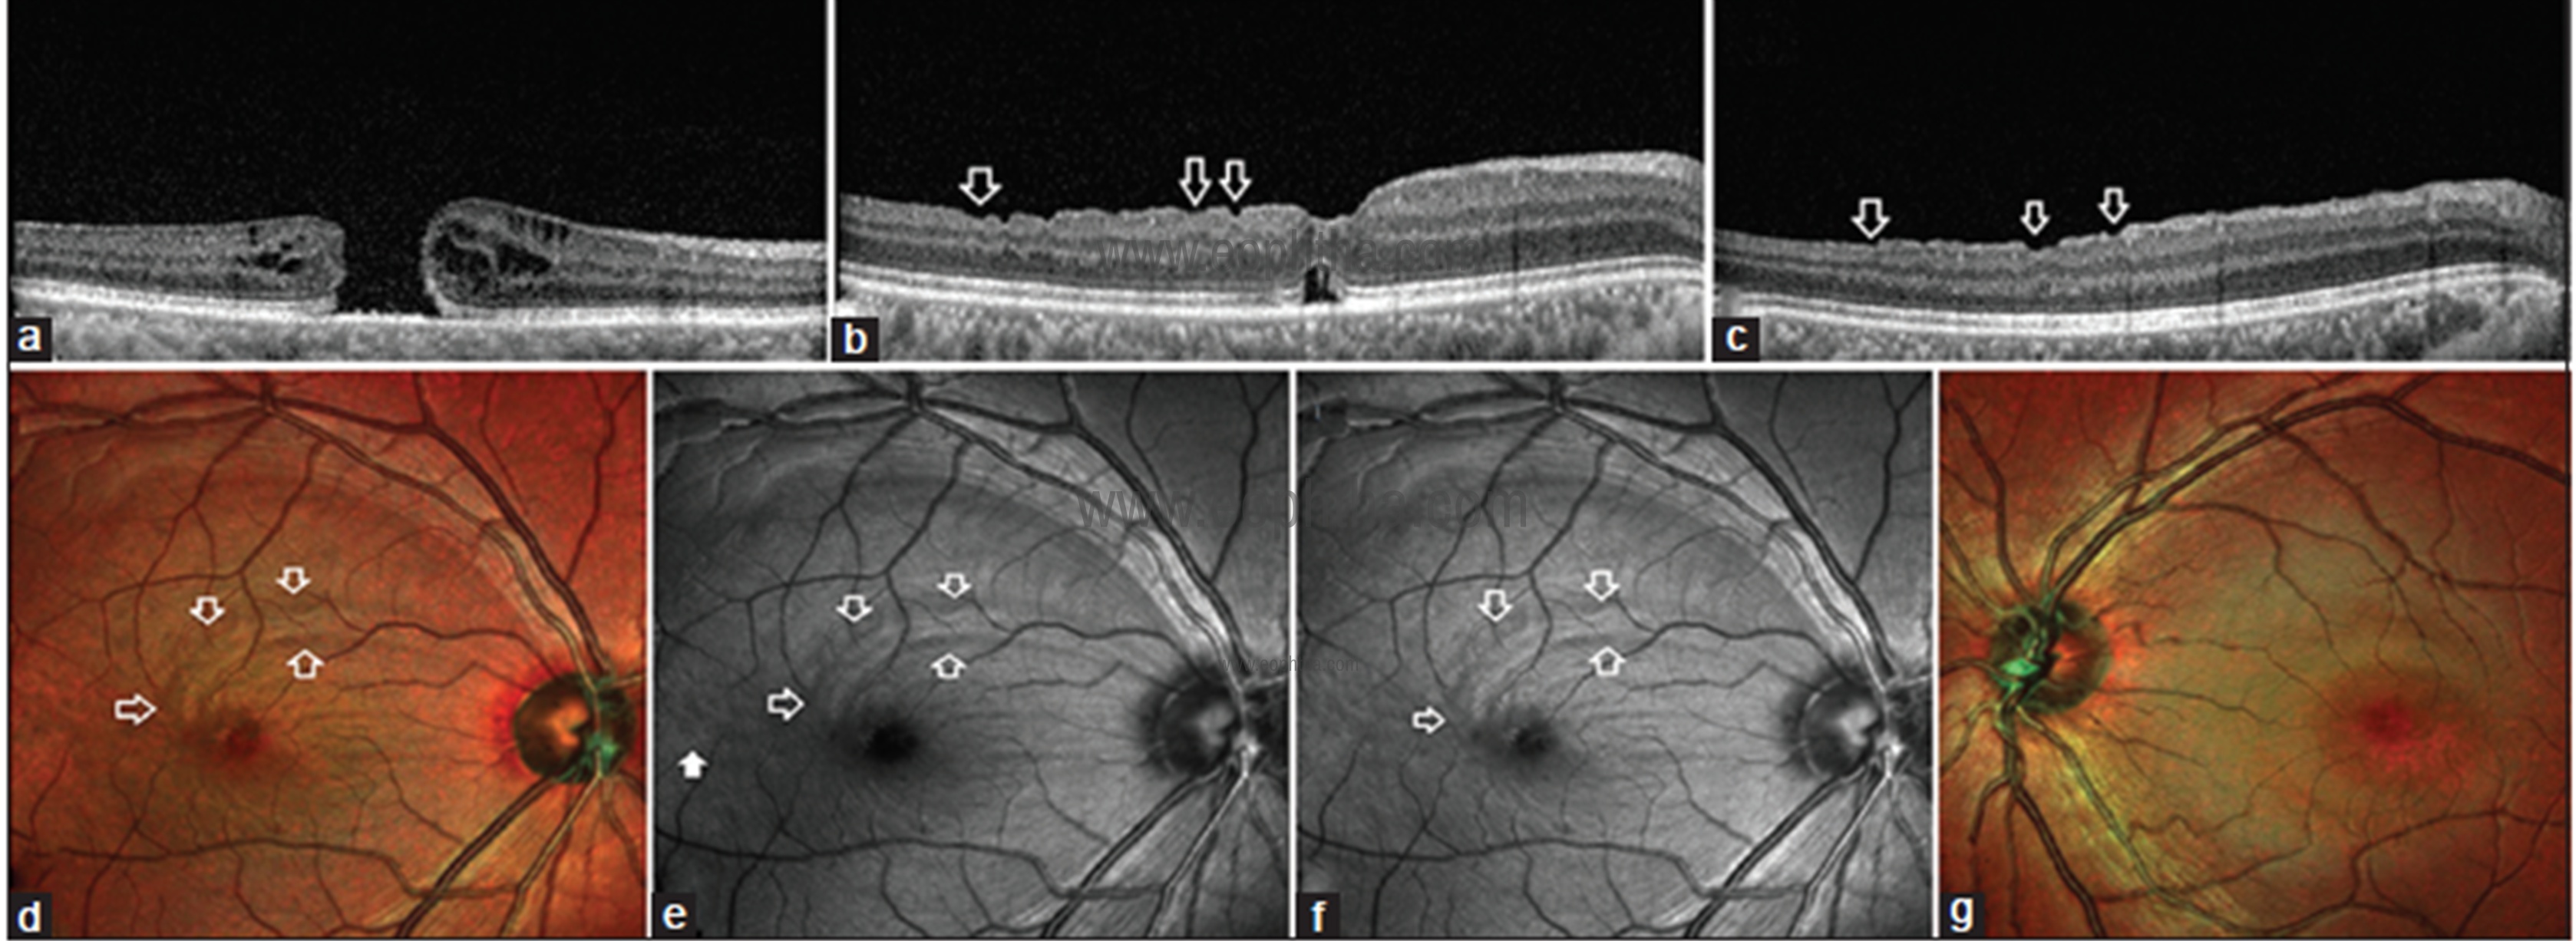
Fig 8: Preoperative line scan SDOCT image (a) through fovea shows a full-thickness macular hole. Postoperative SDOCT line scan (b) across fovea shows dissociated optic nerve fiber layer (DONFL) as irregular depressions in the retinal contour (white blank arrows) due to focal thinning of ganglion cell layer and hyporeflectivity of the retinal nerve fiber layer. SDOCT line scan (c) superior to fovea also shows depressions in the retinal contour (white blank arrows) suggestive of DONFL. Multicolor image of the right eye (d) shows a closed macular hole with darker arcuate zone superior and temporal to fovea (white blank arrows) suggestive of DONFL defects. BR (e) shows the arcuate zone of DONFL (white blank arrows). Discrete dissociated optic nerve fiber layer lesion is noted temporal to fovea (white solid arrow) which is not visible on a multicolor image. GR (f) shows the arcuate zone of DONFL (white blank arrows). Discrete DONFL lesion noted temporal to the fovea in (e) is not visible in this GR image. Multicolor image of the normal left eye (g) shows normal greenish hue which is uniform across around fovea.
Macular telangiectasia type 2
Macular telangiectasia type 2 (MacTel) is a bilateral retinal disease that seems to be limited to the juxtafoveal region of macula and usually diagnosed in the fifth or sixth decade of life. Key diagnostic features of MacTel include graying of parafoveal area, superficial retinal crystals, right angled venules and pigment hyperplasia. BR imaging has emerged as a promising rapid, non-invasive diagnostic tool for MacTel that shows a characteristic oval parafoveal area of increased reflectance.18,19 Superficial retinal crystals and right angles venules are also better visualized on MCI (Fig 9).

Fig 9: CFP) of the right eye (a) shows yellow crystals (white arrow), dark pigments (black arrow), right-angled venule (blue arrow) and graying (yellow arrowheads) at the macular area.MCI highlights yellow crystals (white arrow), dark pigments (black arrow) as orange color, right-angled venule (blue arrow) and larger area of graying (yellow arrowheads). The area of graying (yellow arrowheads) is better visualized in BR (d) as compared to GR (c) and IR (e). Right-angled venule (blue arrow), pigments (black arrow), and crystals (white arrow) are better seen in GR (c) and BR (d) as compared to IR (e).
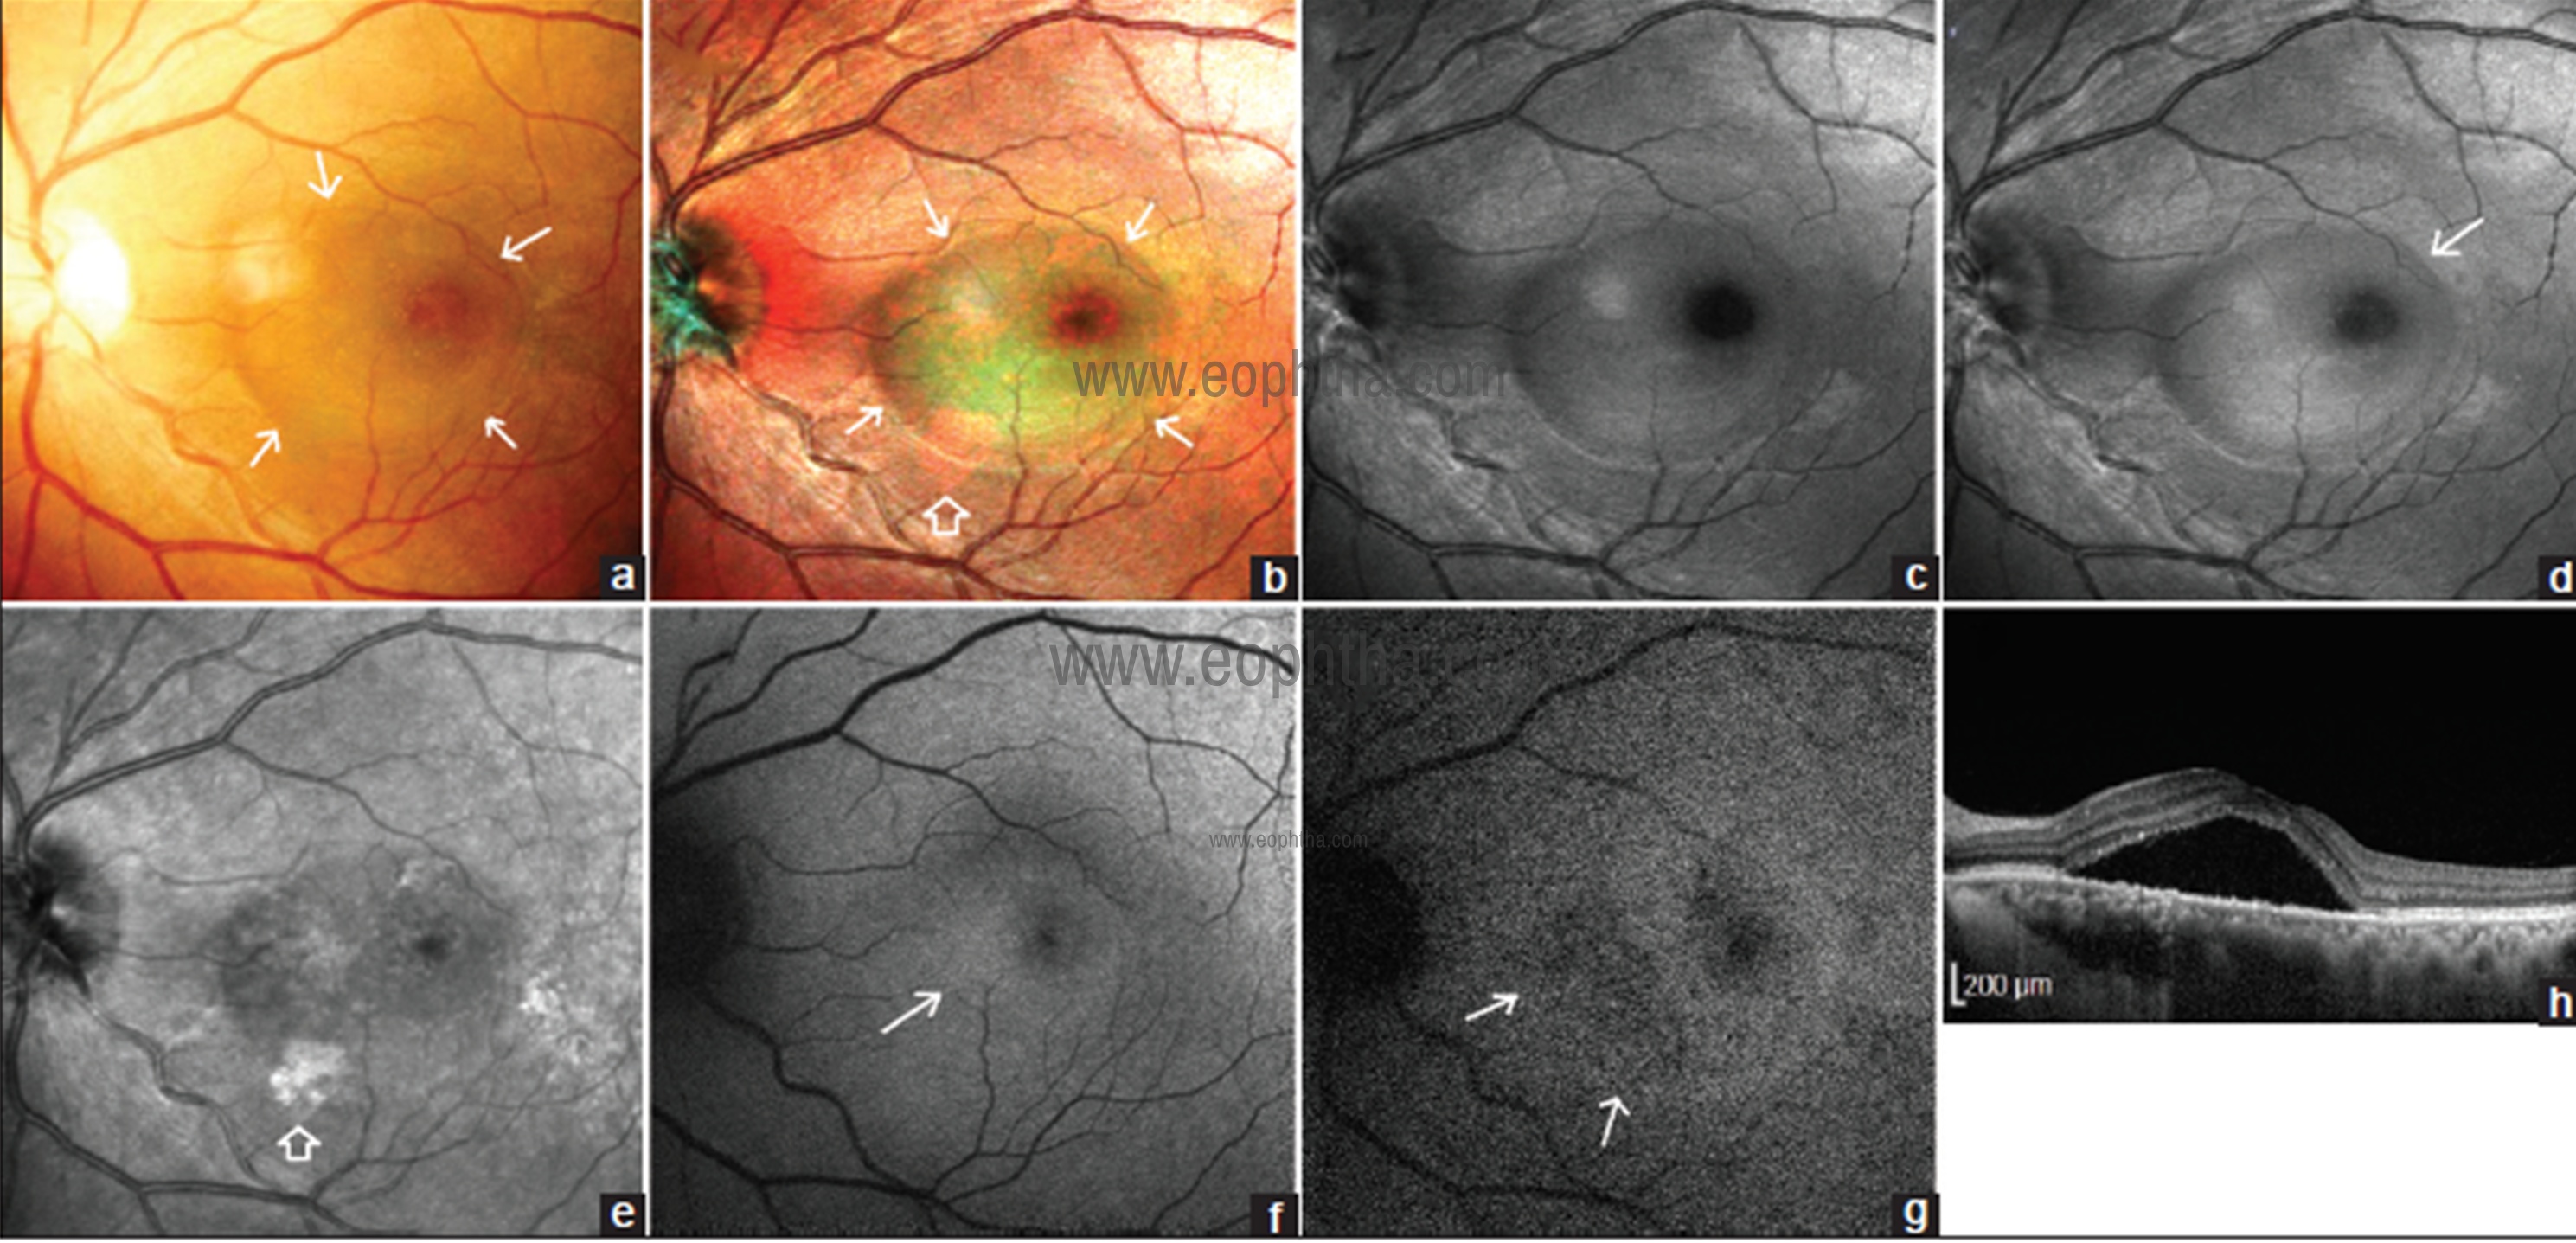
Fig 10: CFP of left eye (a) shows subretinal fluid (SRF) marked with white arrows as a bleb at the center of macula. SRF is seen more distinctly in MCI (b). Margins of SRF (white arrow) are better delineated than CFP. Not the orange-pink coloration of retinal pigment epithelium (RPE) atrophy near the inferior margin of SRF (blank arrow) BR (C) shows the SRF as bleb. GR (d) shows SRF better than BR. The temporal margin (white arrow) is better demarcated than BR image. SRF is seen less distinctly than BR and GR images and is detected as hyperreflectivity at the site of the bleb of SRF (e). Note the hyperreflective RPE atrophy (blank arrow) coinciding with same seen on MCI in (b). On blue autofluorescence (BAF) (f) the foveal zone of normal hypoautofluorescence is reduced and hyperautofluorescence is seen inferonasal to fovea (white arrow) which coincides with zone of greenish hue seen on MCI. The normal hyperautofluorescence at fovea (g) due to maximum melanin content in infrared autofluorescence (IRAF) image is replaced by hypoautofluorescence due to the presence of SRF. Note the inferonasal hypoautofluorescence (white arrow) denoting RPE atrophy which is not seen on BAF and coincides with orange-pink discoloration seen on MCI in (b). SDOCT scan (h) through fovea shows the SRF.
Central serous chorioretinopathy
Central serous chorioretinopathy (CSC) is characterized by serous retinal detachment and RPE detachment involving macula. He et al. have reported that MCI was superior in the delineating area of SRF compared to CFP. 20 Venkatesh et al. have compared MCI with CFP and fundus fluorescein angiography (FFA) and reported that MCI was similar to FFA in identifying focal leaks.21 They also reported that MCI was able to detect PED and RPE atrophy. Saurabh et al compared the ability of MCI to detect the lesions of CSC against conventional CFP.22 SRF was seen as greenish hue over the retina on MCI. Keeping SDOCT as gold standard, MCI was able to pick SRF in more number of eyes than CFP. SRF was best seen on GR. (Fig 10) MCI detects PED as an elevation of retinal contour and renders it greenish hue which is darker than SRF because PED is present at deeper level than SRF. Smaller well-circumscribed size and surrounding pink ring differentiate PED from SRF on MCI. (Fig 11) PED was best detected on IR image due to its deeper location. RPE atrophy was seen better on IR image than BR or GR images. Focal leaks appear as orange spots on MCI. Pachyvessels are seen as a bright orange vascular network.
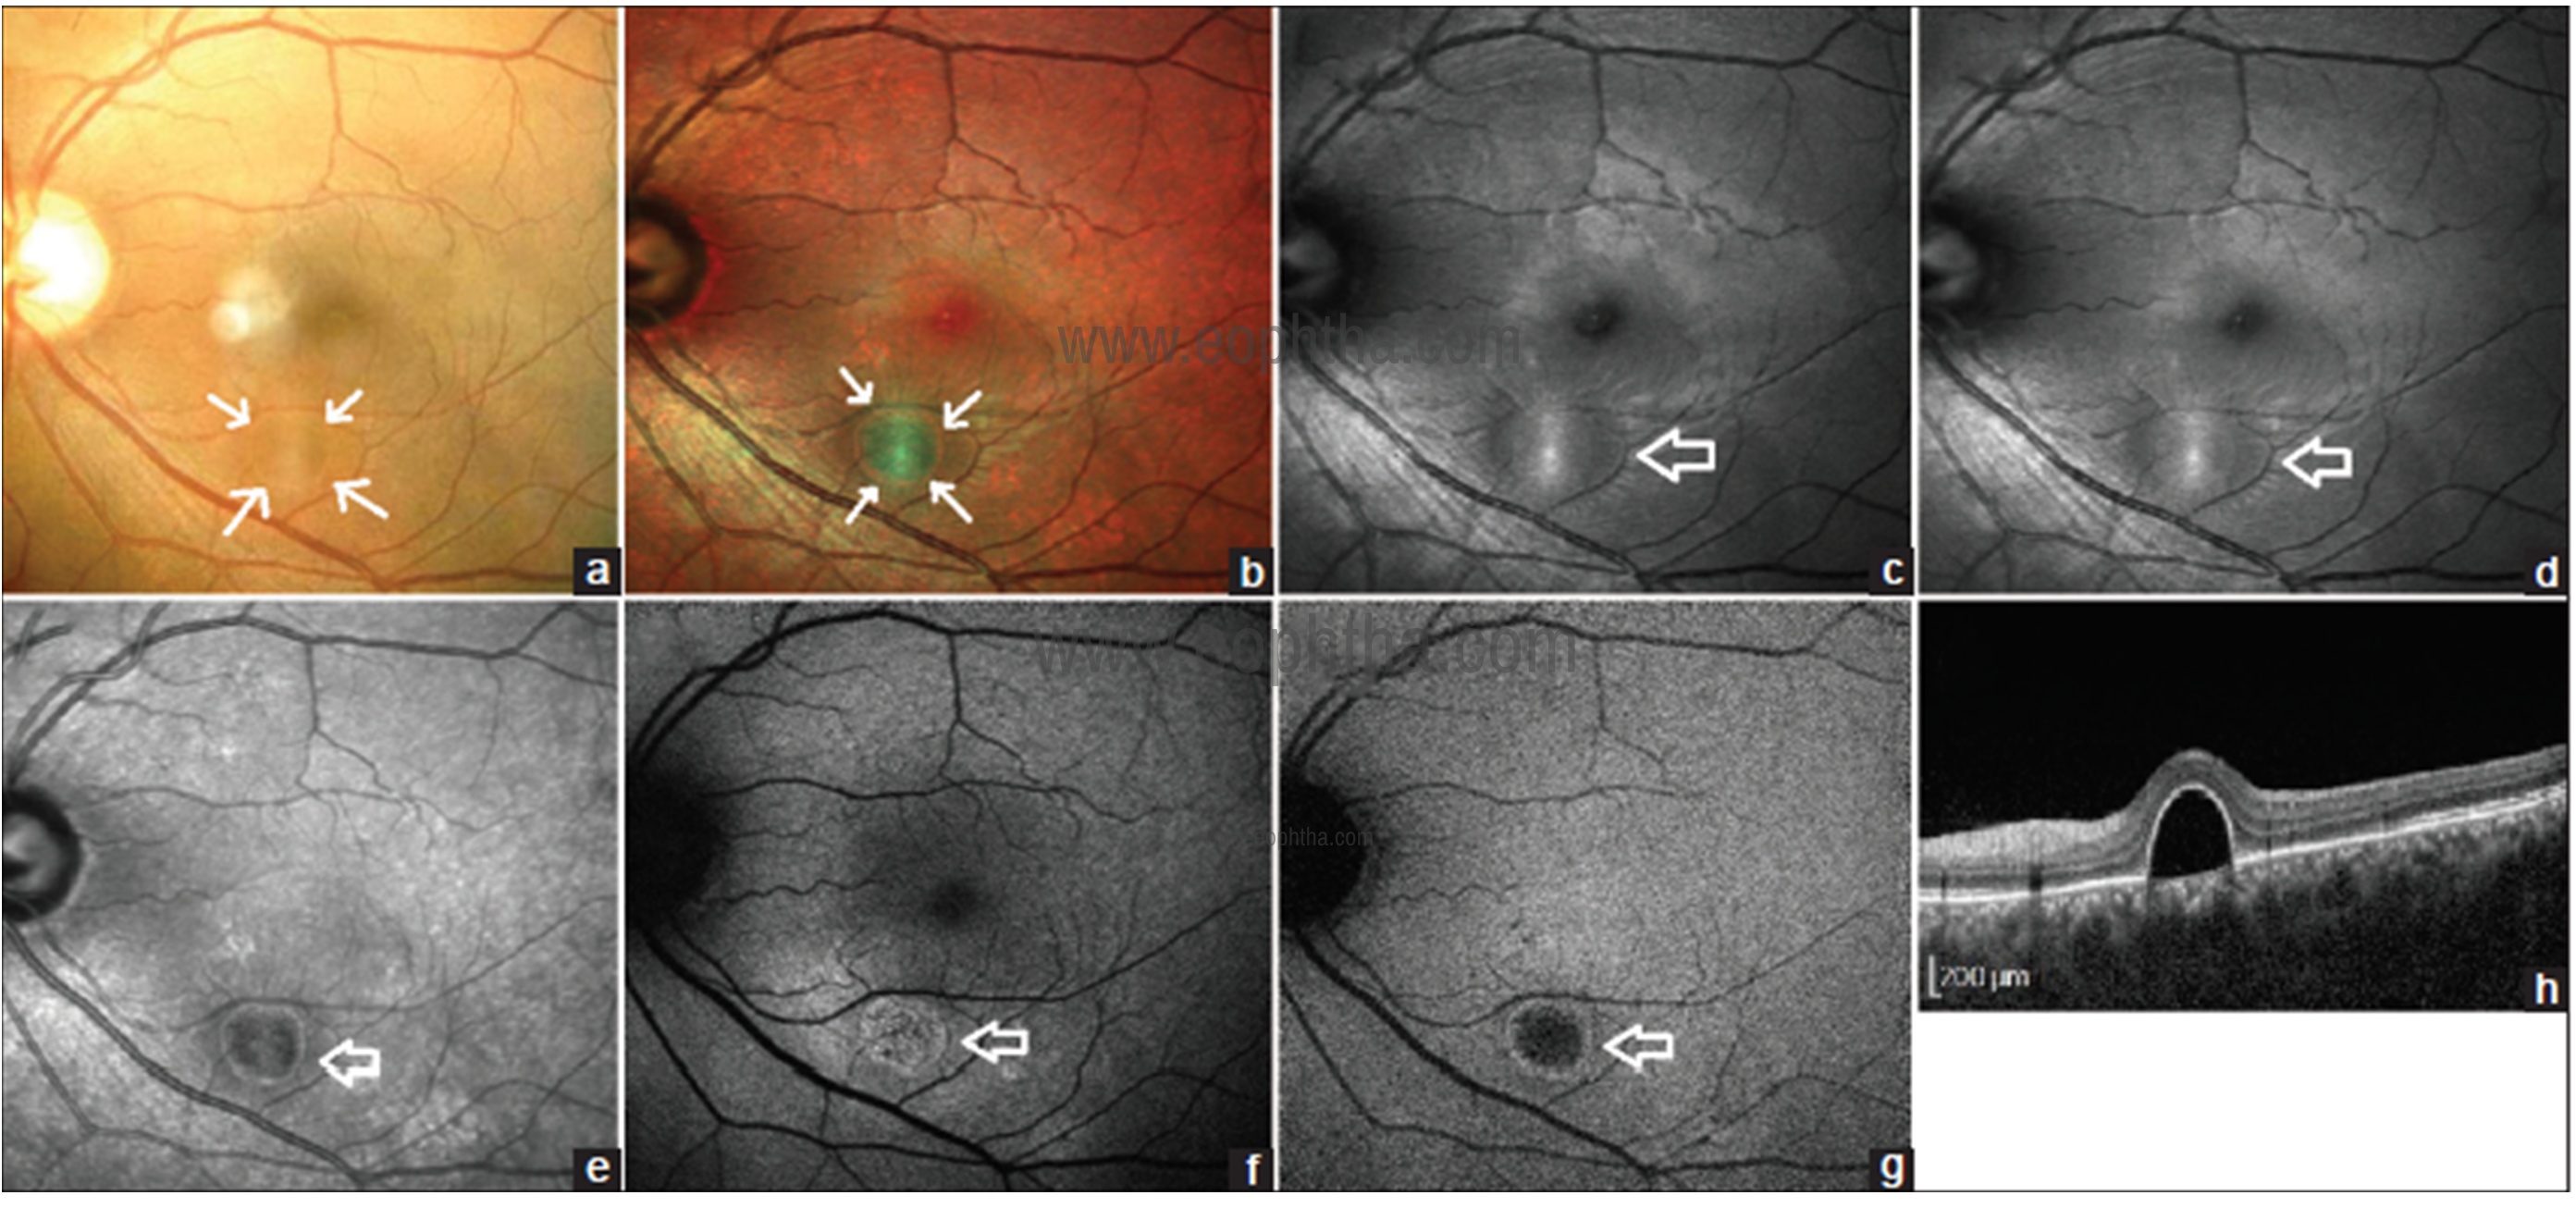
Fig 11: CFP of the left eye (a) shows retinal pigment epithelial detachment (PED) as round elevation (white arrow). MCI (b) shows PED as a greenish lesion with a pink ring surrounding it (white arrow). PED is seen more distinctly on MCI than CFP. BR (c) shows PED as a circumscribed zone of central hyperreflectivity at peak flanked by zone of hyperreflectivity (blank arrow). GR (d) shows a similar pattern as BR (blank arrow). PED appears as hyporeflective lesion (blank arrow) surrounded by rim of hyperreflectivity on IR image (e). BAF (f) shows stippled hyperautofluorescence (blank arrow) at the site of PED. PED appears as central hyperreflectivity (blank arrow) surrounded by hyperautofluorescent rim on IRAF image (g). SDOCT line scan (h) shows serous PED.
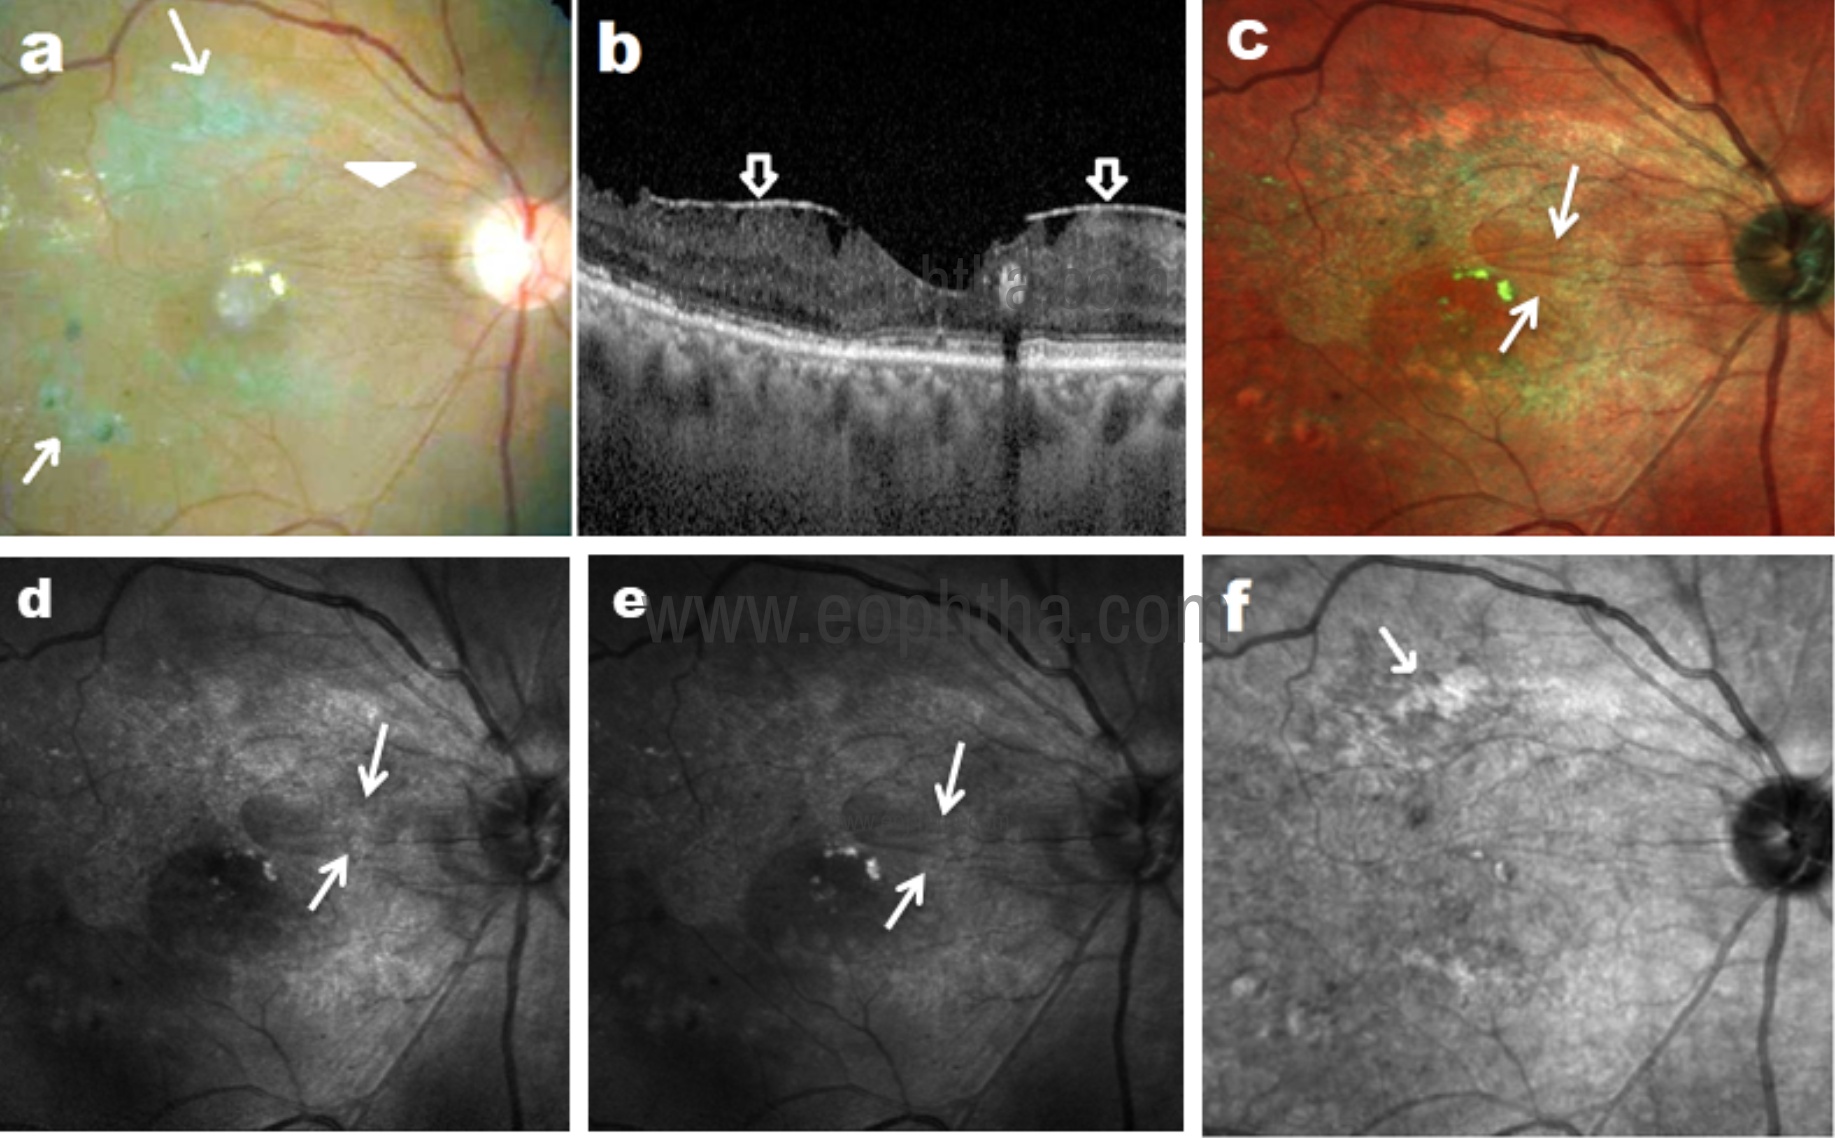
Fig 12: CFP (a) shows epiretinal membrane (ERM) as fine striataions (arrowhead) and laser marks (arrow) in a patient with diabetic retinopathy. SD-OCT (b) shows ERM. MCI (c) highlights ERM as bright greenish lines. Hyper-reflective folds of ERM are well visualized in BR (d) and GR (e) images as compared to IR image (f).
Epiretinal membrane
Muftuoglu et al. have studied epiretinal membrane (ERM) with MCI and have concluded that it was better visualized on MCI as compared to CFP.23 GR image is best suited to image hyper-reflective surface folds of ERM (Fig 12). Multicolor image highlights ERM as greenish retinal folds. The ERM area is more clearly detectable and widely demarcated in MCI than in CFP images.24
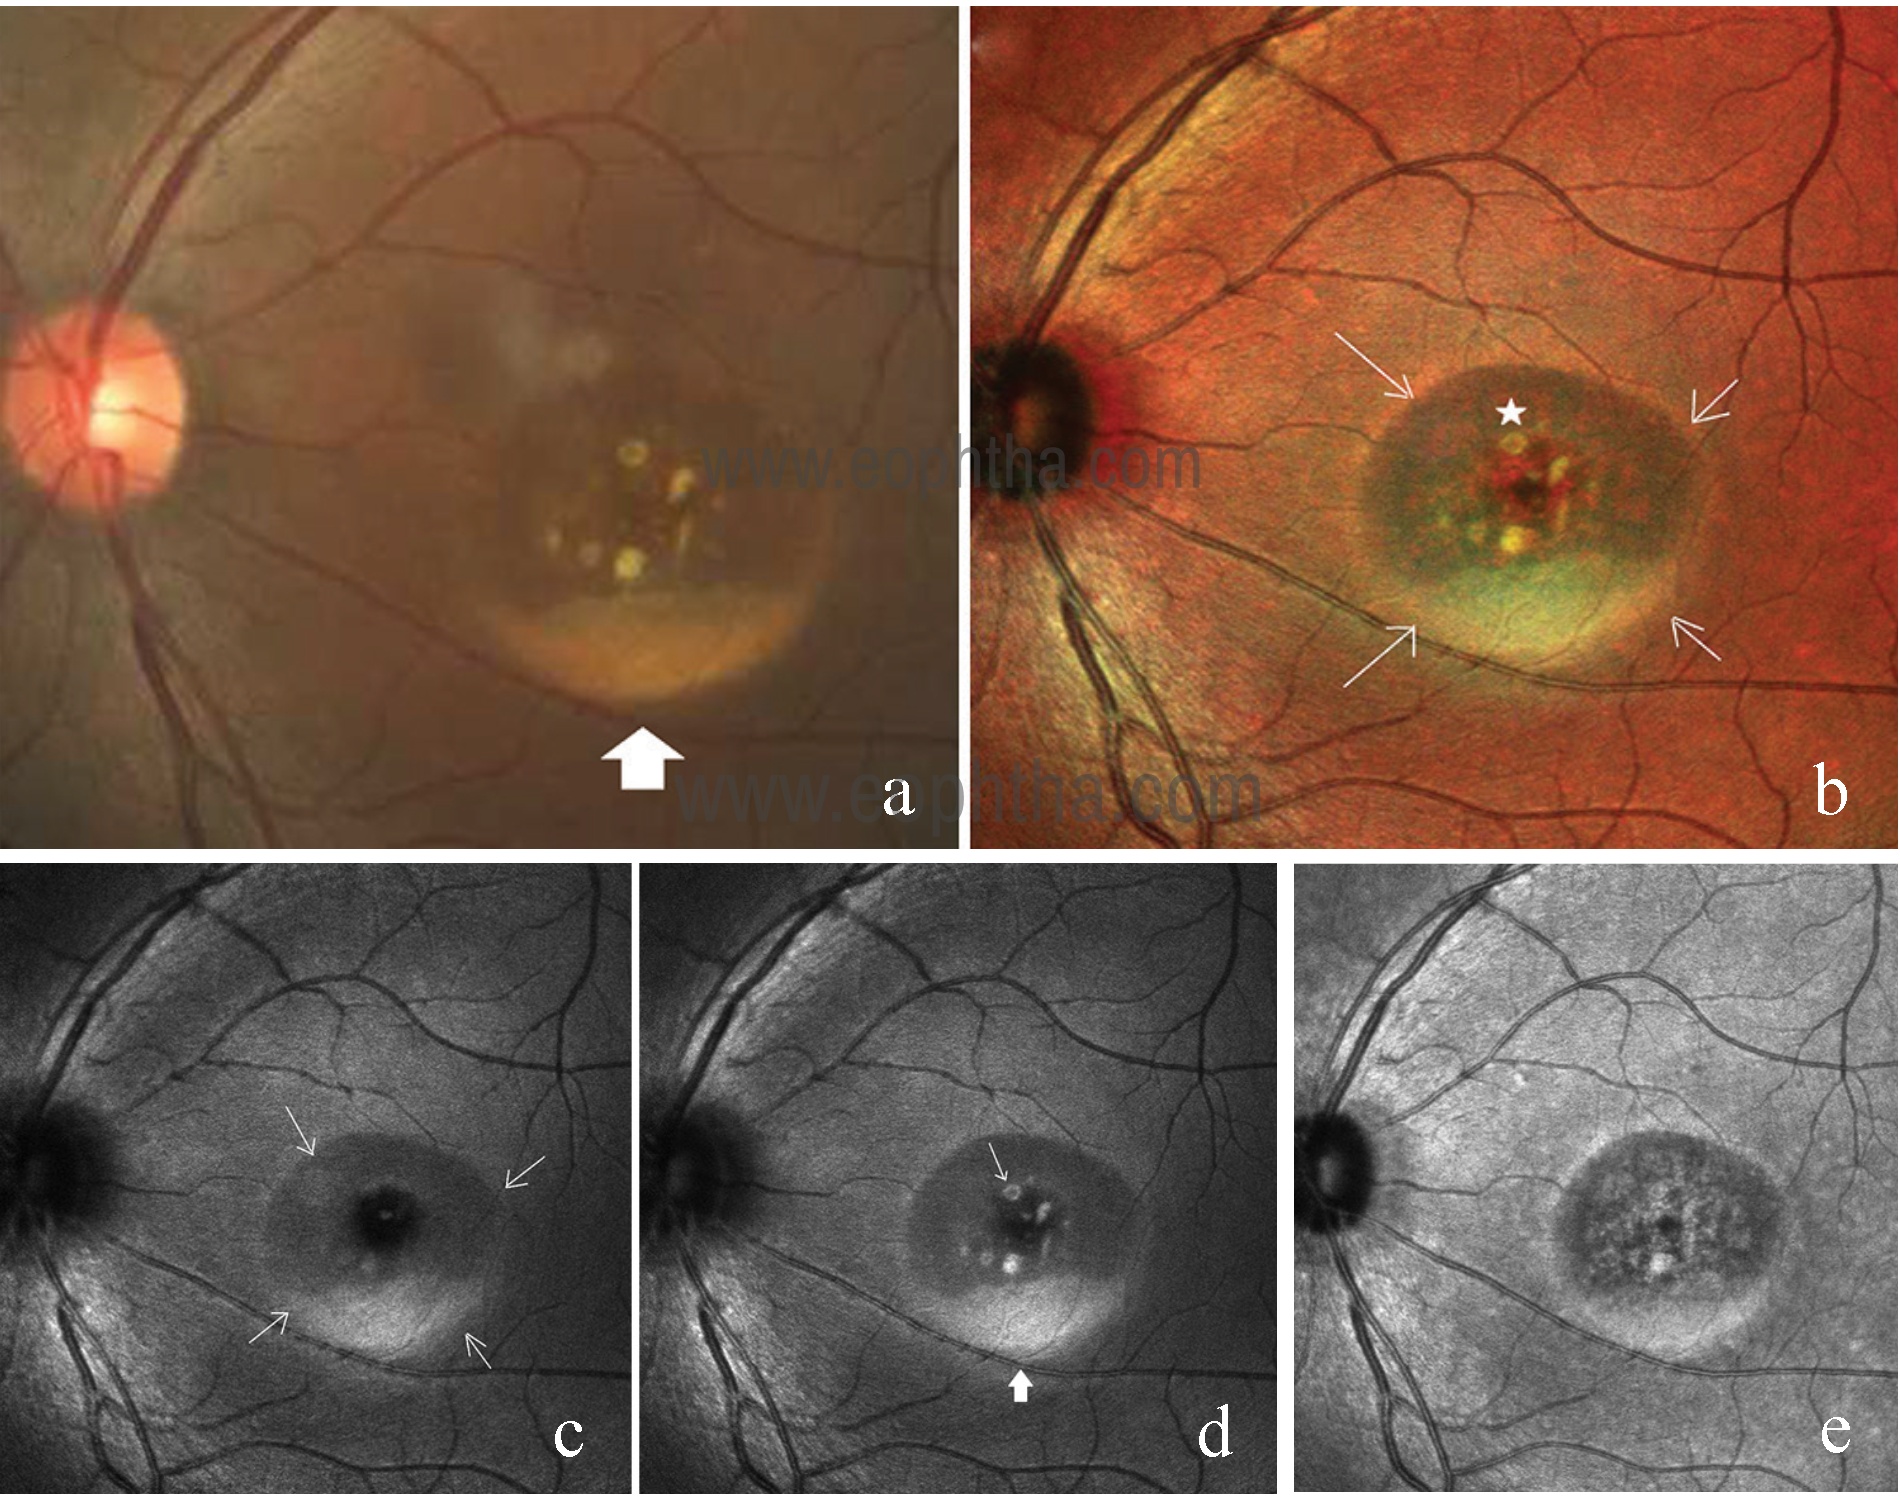
Fig 13: CFP of the left eye (a) shows the area of retinal elevation at the center of the macula with yellowish subretinal deposit at the dependent part (solid white arrow) suggestive of lipofuscin. Composite multicolor image (b) gives blue-green hue to the elevated retina and delineates the margin of elevation sharply (white arrows). Subretinal yellowish lipofuscin deposits (solid star) are brighter than composite CFP. BR image (c) shows a well-circumscribed ring of retinal elevation (white arrow) with subretinal lipofuscin. Subretinal lipofuscin layered inferiorly (solid arrow) and scattered through the retinal elevation (white arrow) appeared brighter on GR image (d). IR image (e) shows RPE mottling within the area of retinal elevation.
Retinal dystrophies
Utility of MCI has been described in various retinal dystrophies.
Best vitelliform dystrophy
Saurabh et al. have reported MCI characteristics of Best’s Vitelliform Macular Dystrophy (BVMD). 25 Composite multicolour image revealed larger area of RPE atrophy in vitellieruptive stage of the disease compared to CFP. Retinal elevation in the pseudohypopyon stage was better delineated on composite multicolour image and BR image. Subretinal lipofuscin was best seen in GR image (Fig 13).
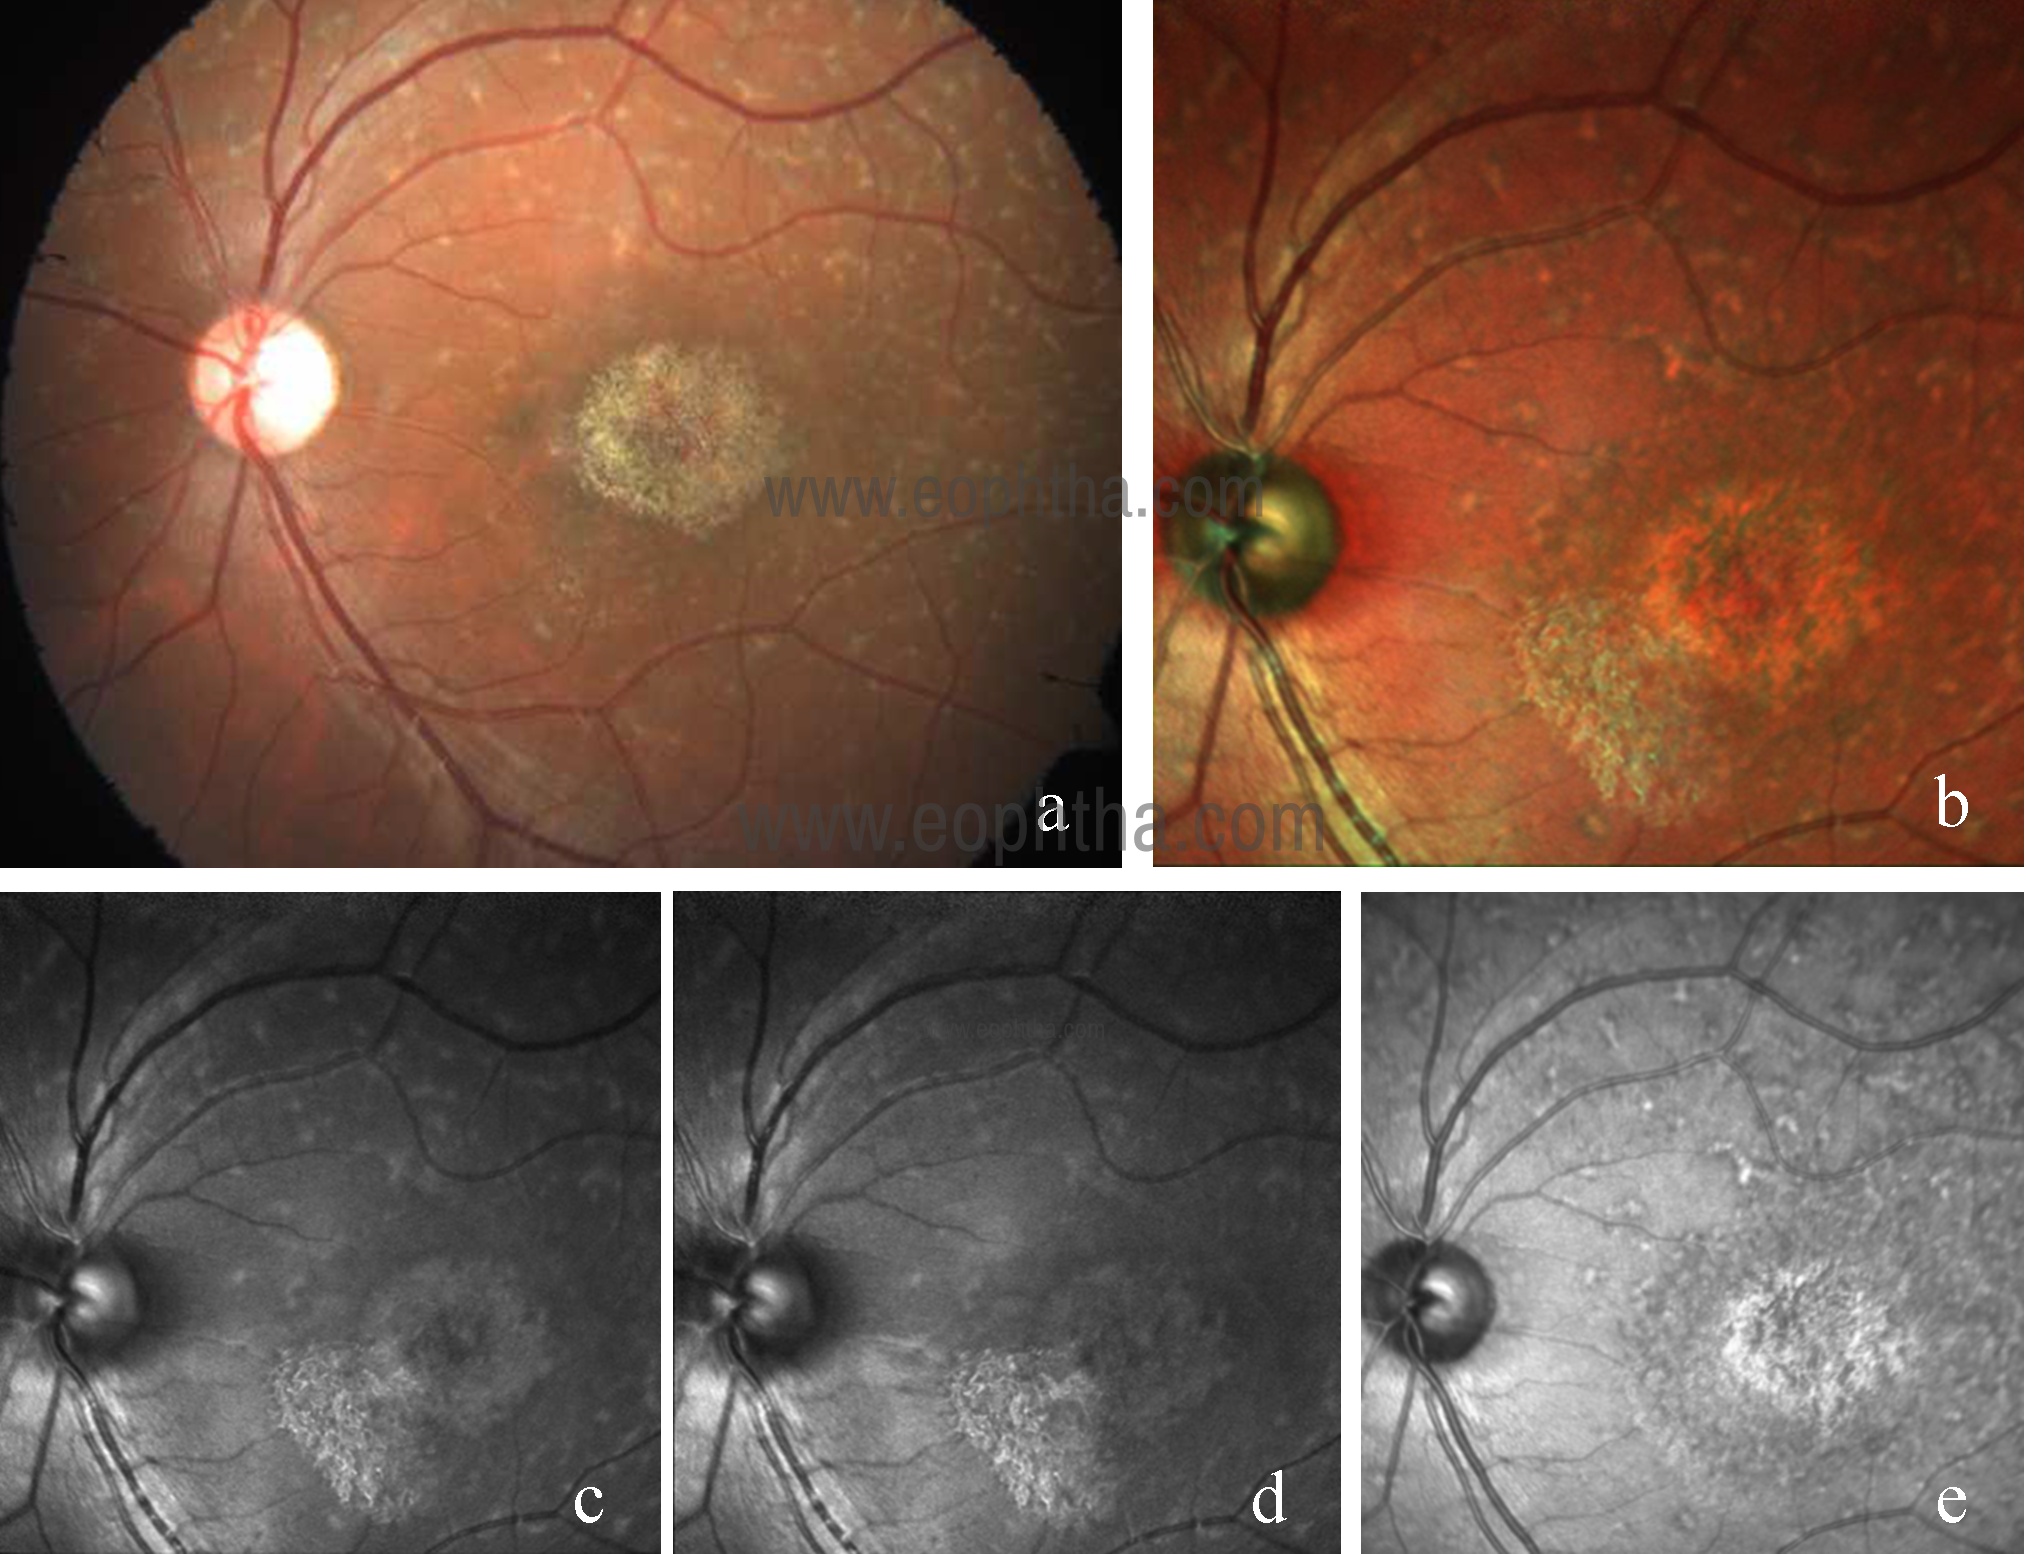
Fig 14: CFP of left eye (a) in Stargadt disease showing yellowish white retinal flecks and RPE atrophy at macula. Multicolor image (b) highlights the area of RPE atrophy and retinal flecks. Lesions are better visualized on IR (e) as compared to GR (c) and BR (d).
Multifocal Best disease is a rare disease characterized by multiple sharply demarcated yellowish lesions in the posterior pole and beyond arcades. This is considered an atypical variant of BVMD. Shah et al have reported MCI characteristics in these patients.26
The multicolor image showed a greenish hue over the macula suggestive of retinal thickening and multiple orange spots corresponding to yellow lesions. IR image showed multiple white hyper-reflective spots suggestive of alterations at the RPE level, while GR and BR images failed to highlight the lesions clearly.
Stargadt disease
Stargardt macular dystrophy is an autosomal recessive inherited retinal disease. Yellow or white fish-shaped flecks and photoreceptors, RPE and choriocapillaris atrophy are the pathognomonic clinical features of this disease.27 In both CFP and multicolor image, the white flecks of the fundus can be seen. However, the demarcation of the central area of atrophy is more clearly seen on MCI (Fig 14).1
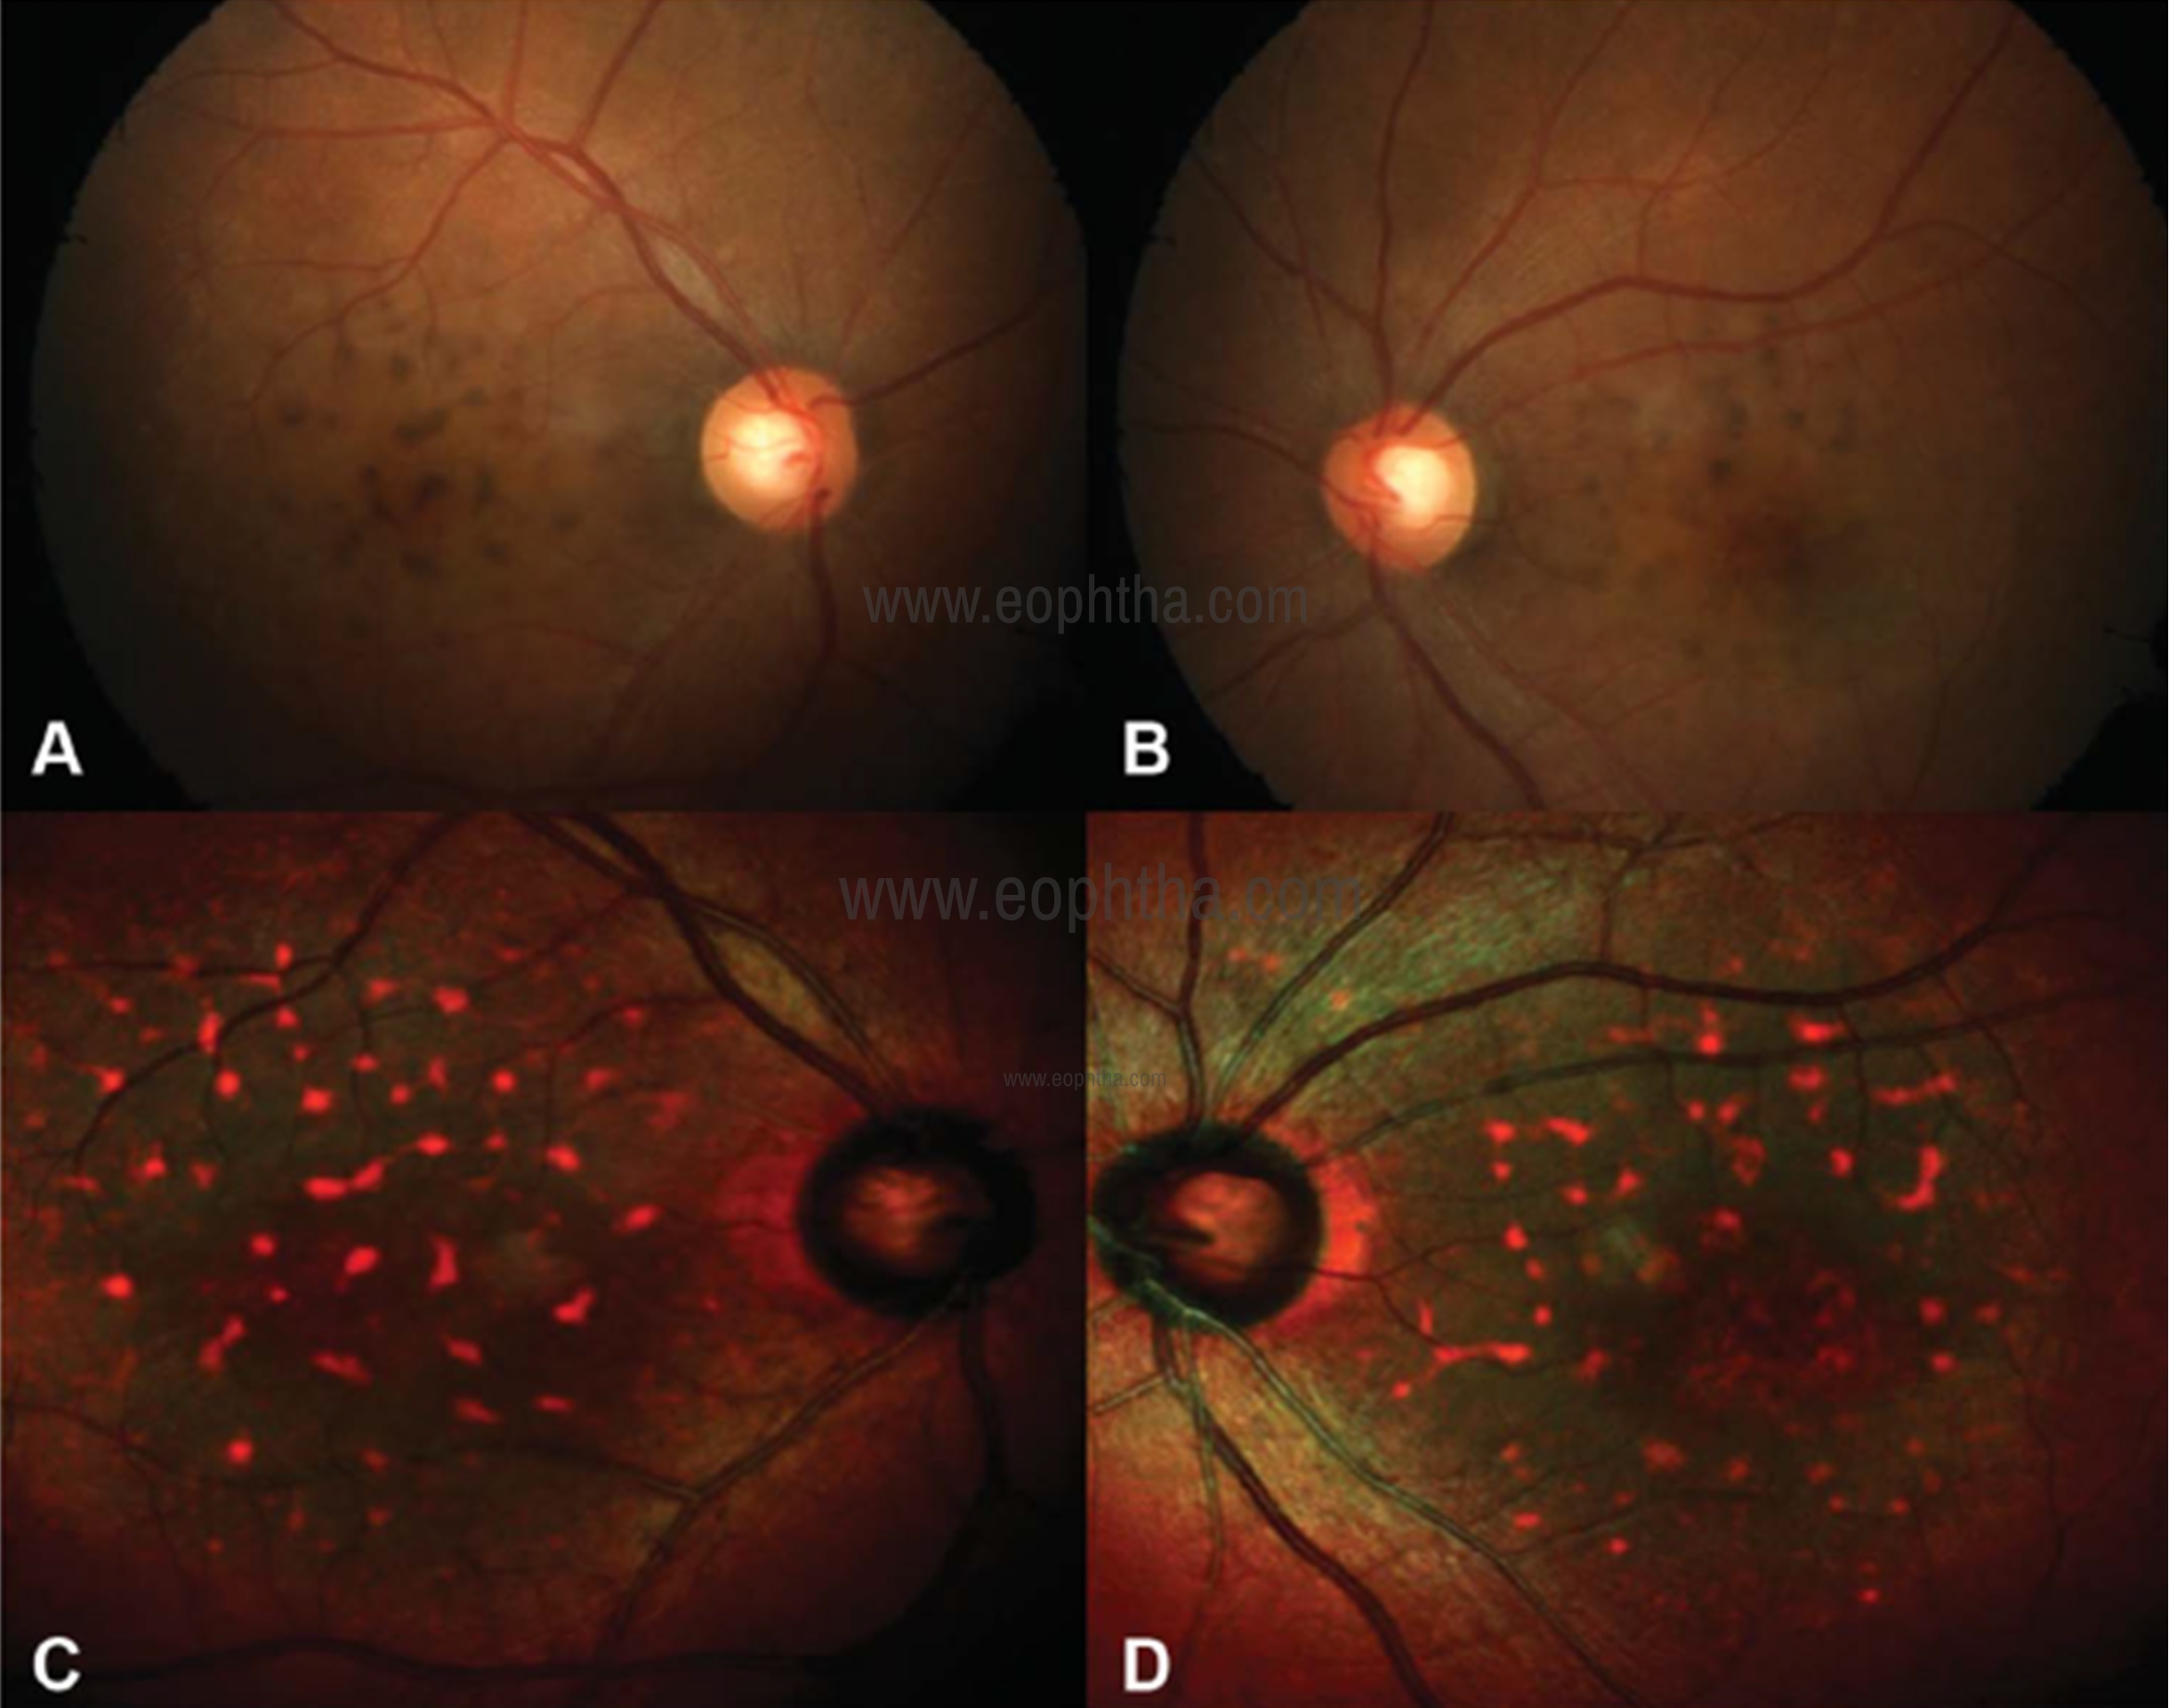
Fig 15: CFP (A and B) of the right eye and left eye showing coarse pigments on the posterior pole. Multicolor image (C and D) showing greenish hue and orange hyper-reflective spots over the macula.
Pattern dystrophies
Pattern dystrophies include butterfly-shaped dystrophy, reticular dystrophy, multifocal pattern dystrophy simulating fundus flavimaculatus, adult vitelliform dystrophy, and fundus pulverulentus. Roy et al. have reported MCI in the case of fundus pulverulentus.28 It is a rare type of pattern dystrophy that is characterized by coarse pigment mottling in the macula. The composite multicolor image showed greenish hue over the macula suggestive of retinal thickening and orange hyperreflective spots suggestive of alterations at the level of RPE (Fig 15). IR imaging localized the lesions to the RPE level (Fig 16).
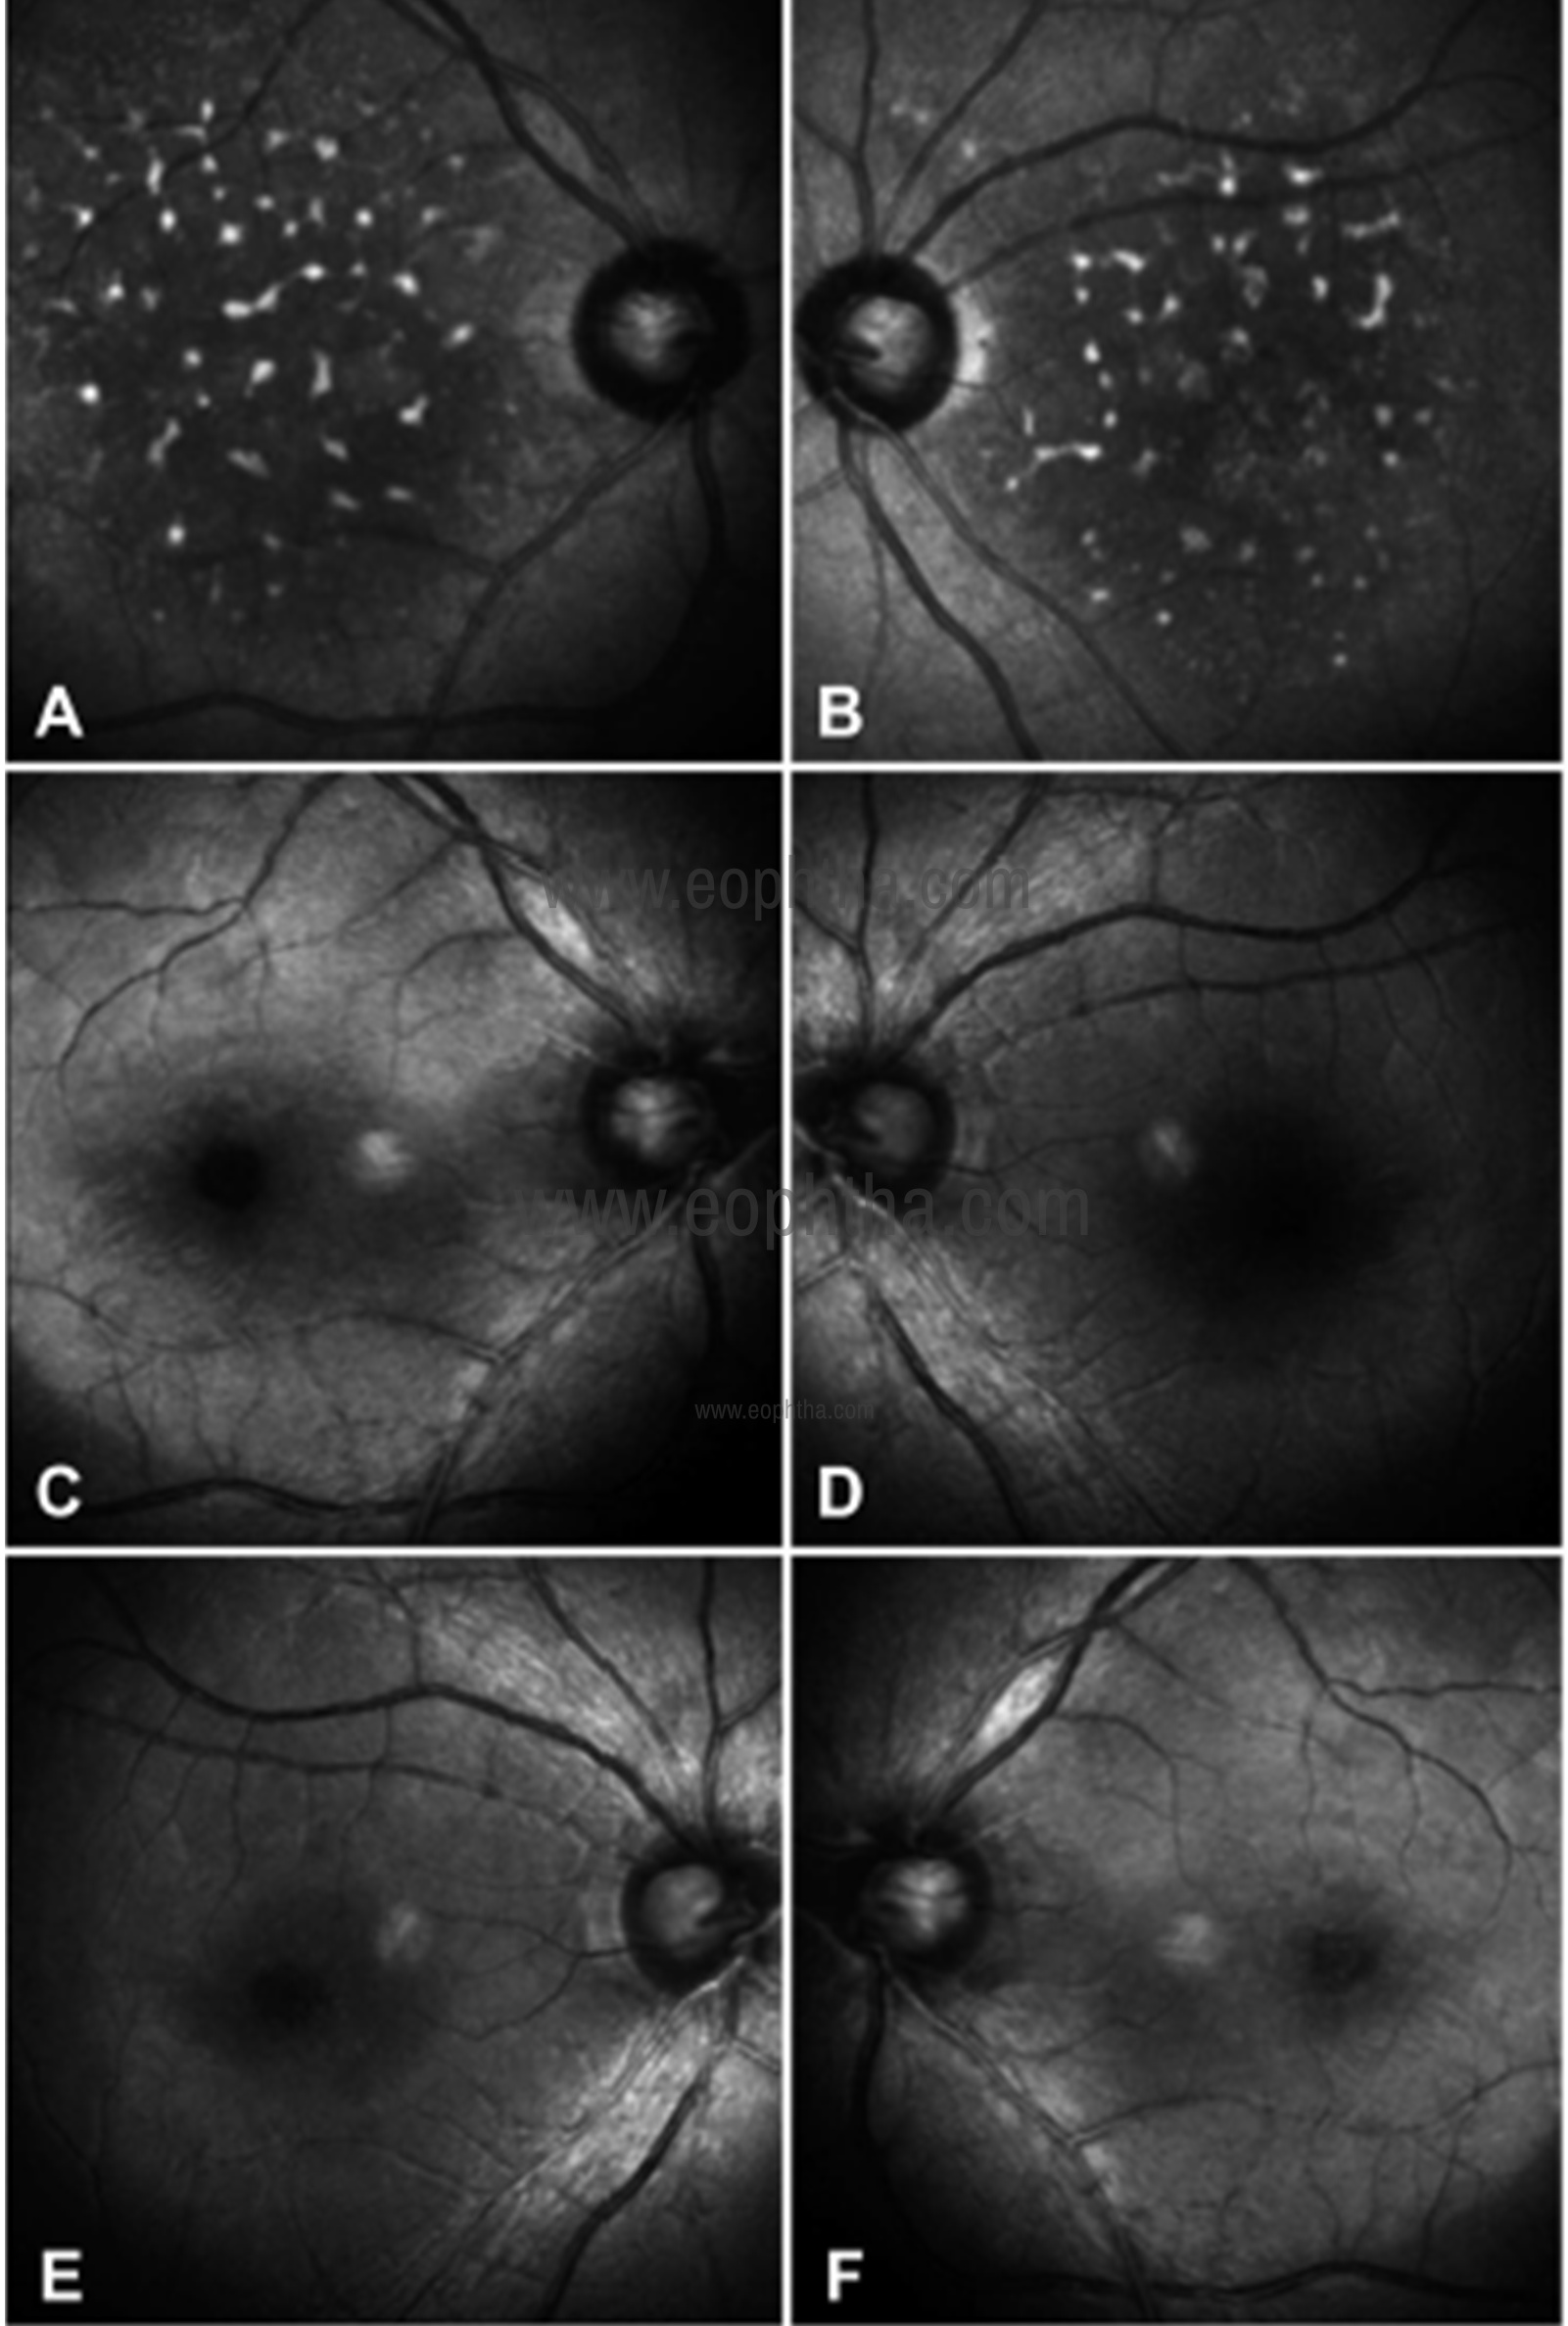
Fig 16: IR image (A and B) of the right eye and the left eye showing multiple white hyperreflectant spots over the posterior pole corresponding to the pigments suggestive of alterations at RPE level, whereas BR (C and D) and GR (E and F) images show no abnormality.
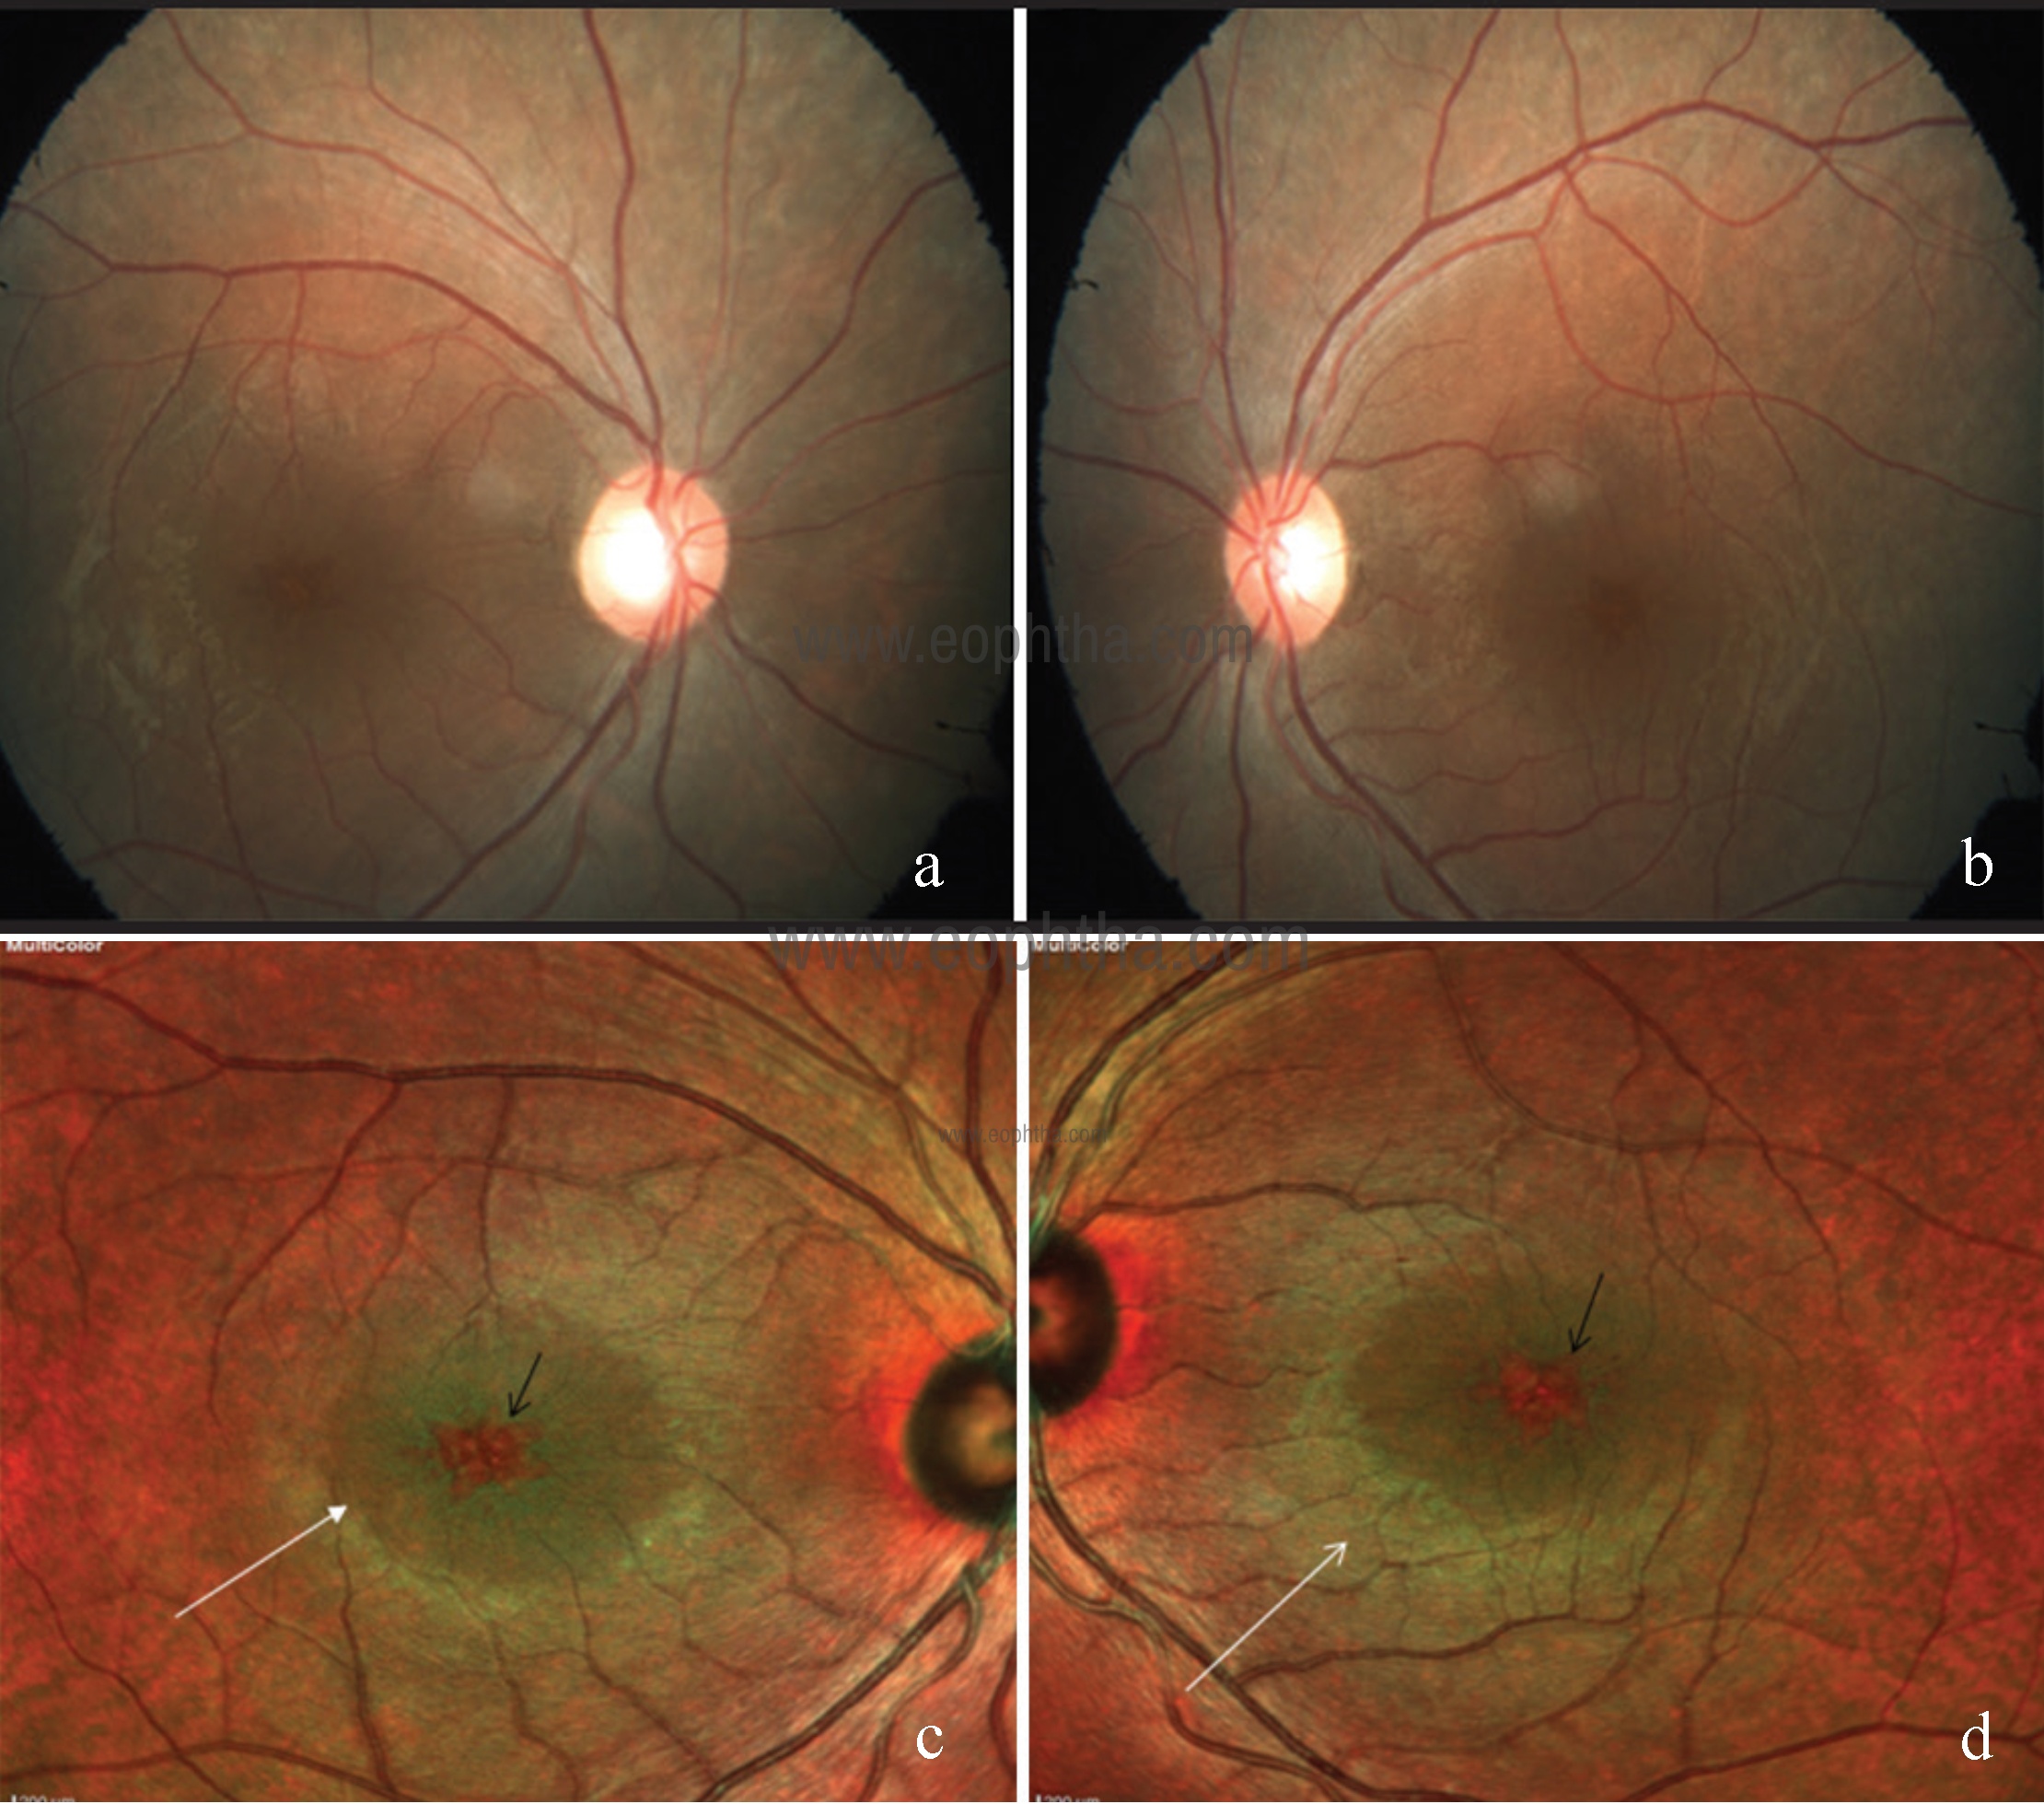
Fig 17: CFP of right (a) and left (b) eye showing cystic spaces at the macula. Multicolor image of right (c) and left (d) eye showing greenish hue at posterior pole suggestive of retina thickening (white arrows) with central orange hyper reflectance at the fovea (black arrows) suggestive of a cyst.
Dominant cystoid macular dystrophy
Dominant cystoid macular dystrophy is a rare inherited retinal disorder that primarily affects the macula. It is unique retinal dystrophy because the appearance of cystic spaces in the macula heralds its onset with the rest of the retina being essentially normal. MCI helps in picking up the cystoid abnormality much efficiently as compared to the conventional CFP (Fig 17).29
Retinitis pigmentosa
Retinitis pigmentosa (RP) is an inherited retinal disease caused by the degeneration of photoreceptors and RPE cells. MCI is capable of detecting macular changes and complications in patients with RP. In a study by Liu et al, MCI clearly defined the borders of the macular‑sparing area corresponding to the relatively intact outer retinal structures on OCT images, particularly the status of the ellipsoid zone and external limiting membrane. 30
Choroideremia
Choroideremia is a rare X‑linked disorder that causes progressive degeneration of retina, RPE and choroid. Goel et al have reported MCI signatures in choroideremia. 31 MCI highlighted the residual RPE tissue at macula and the surrounding chorioretinal atrophy much better than CFP (Fig 18). The residual RPE tissue was well visualized in IR as compared to GR and BR (Fig 19). MCI can be used to evaluate viable retina and document disease progression in patients with choroideremia.
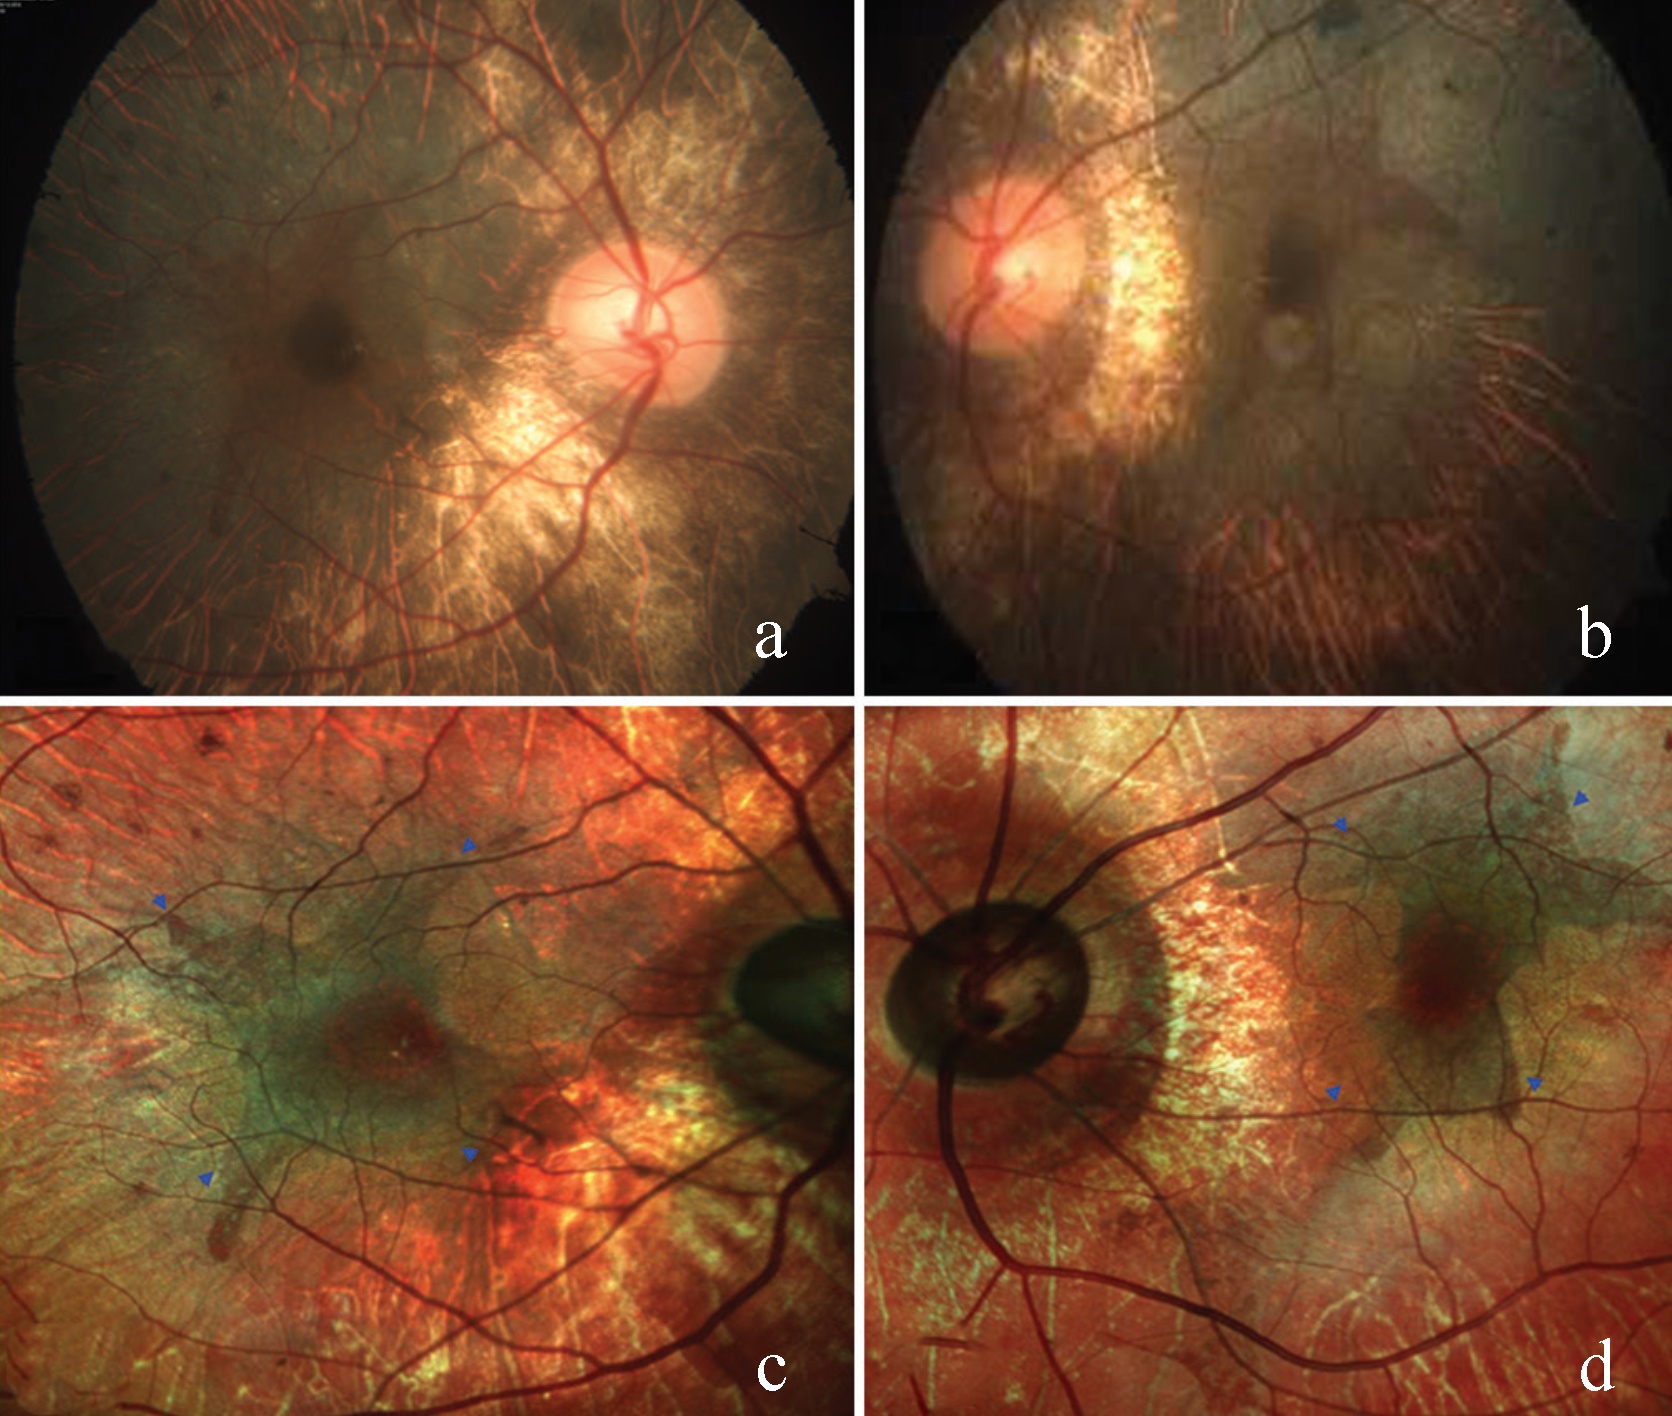
Fig 18: CFP (a and b) showing bilateral chorioretinal atrophy (CRA) and areas of retinal RPE disruption with sparing of the central macula. Multicolor image (c and d) highlighting the residual RPE tissue at macula (blue arrow heads) and surrounding CRA much better than CFP.
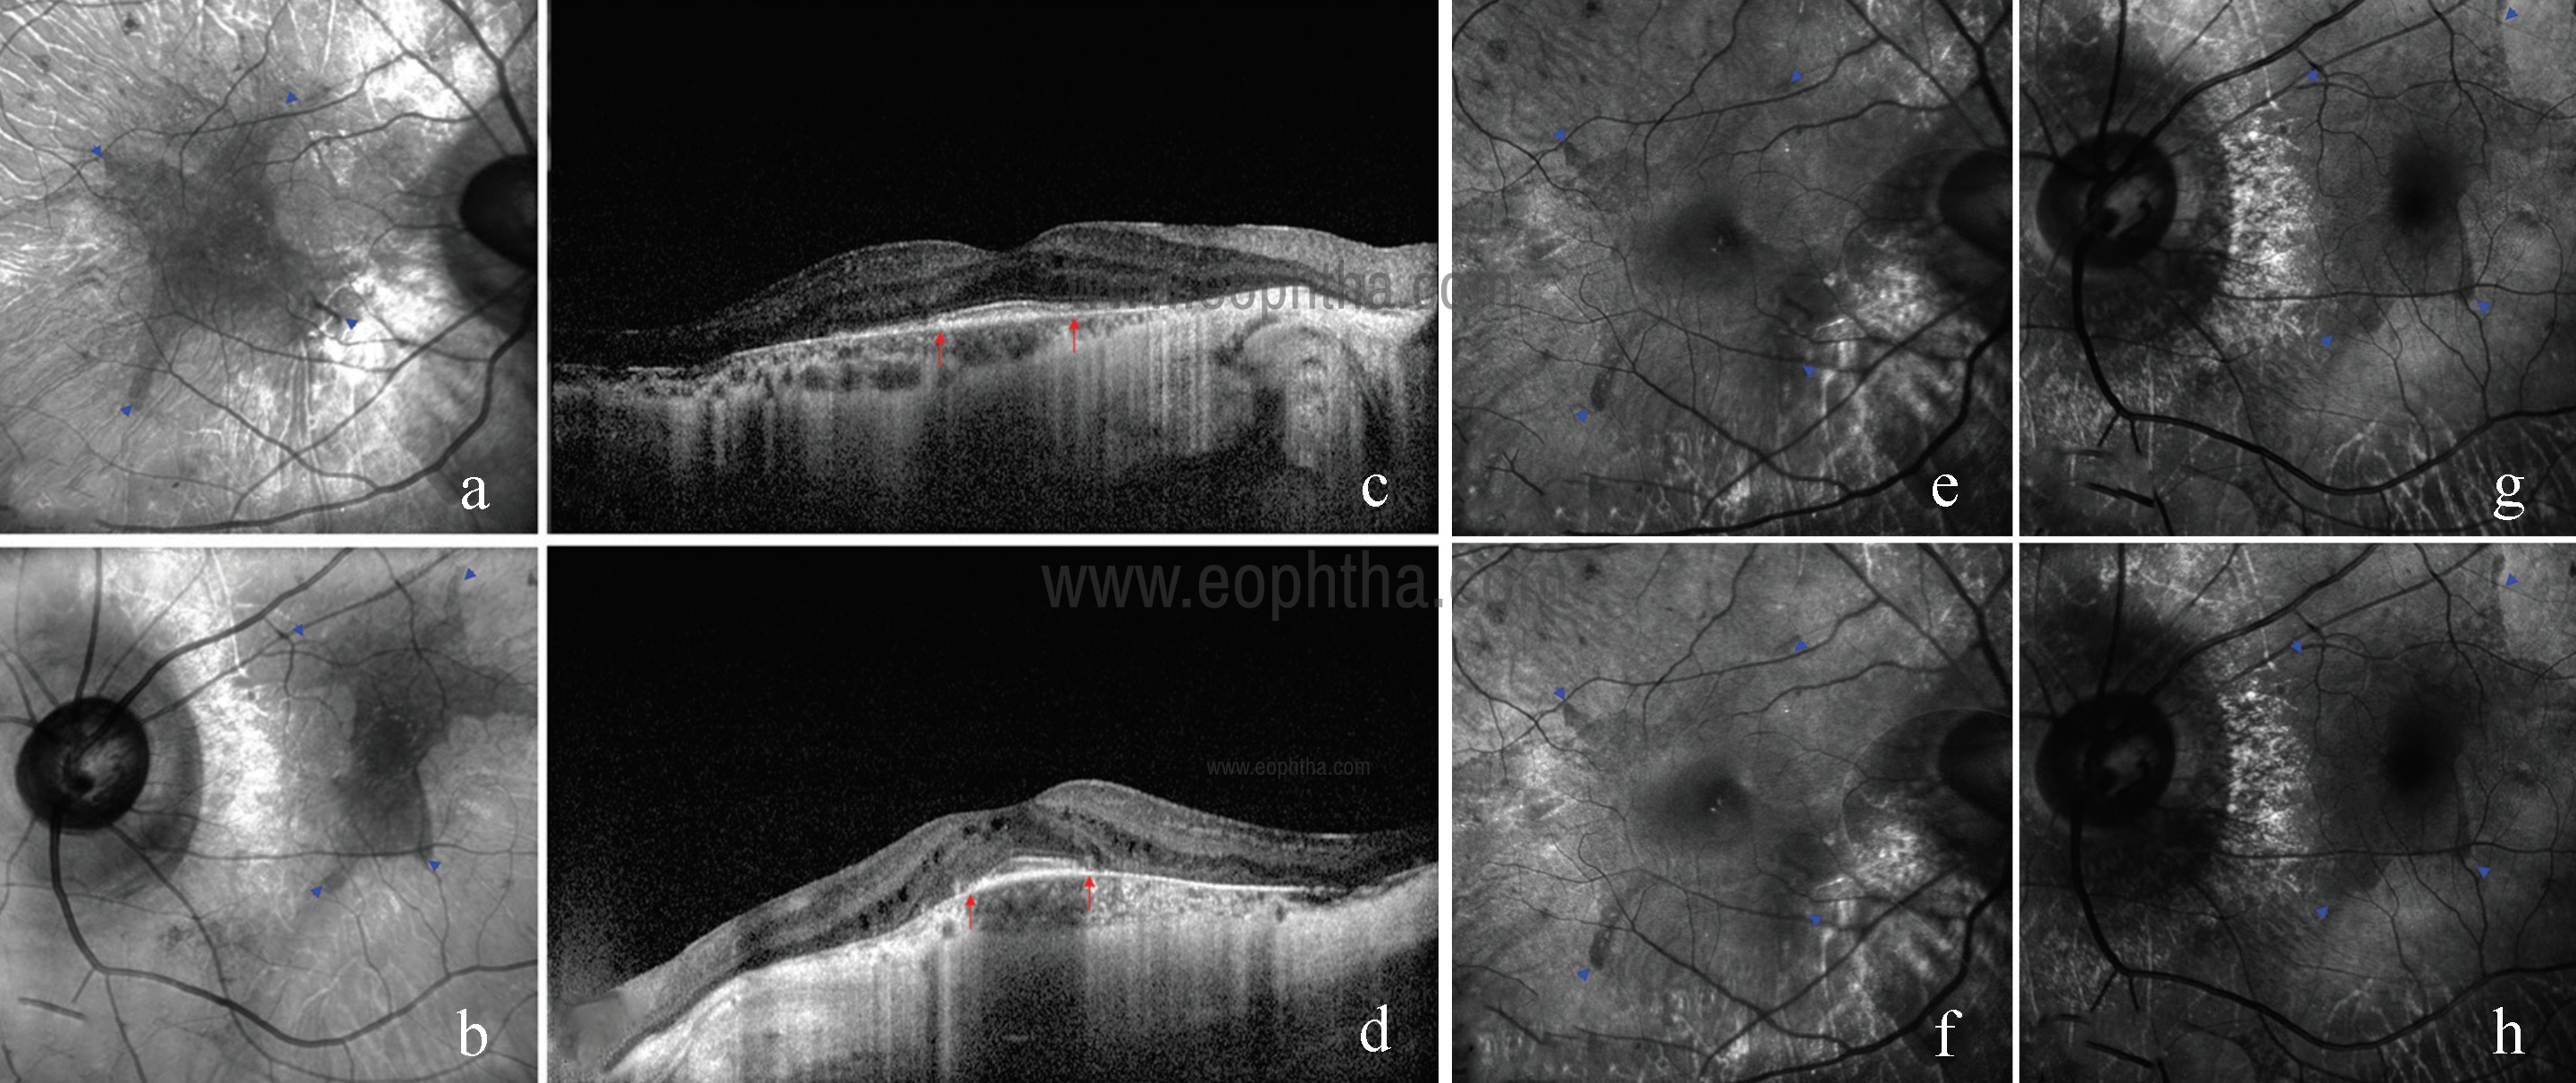
Fig 19: Area of residual RPE tissue (blue arrow heads) is well visualized in IR images (a and b). SDOCT showing retinal thinning and choriocapillary atrophy sparing central macula (red arrows) (c and d). GR images (e and g) and BR images (f and h) of both eyes showing area of residual RPE tissue (blue arrow heads) faintly as compared to IR.
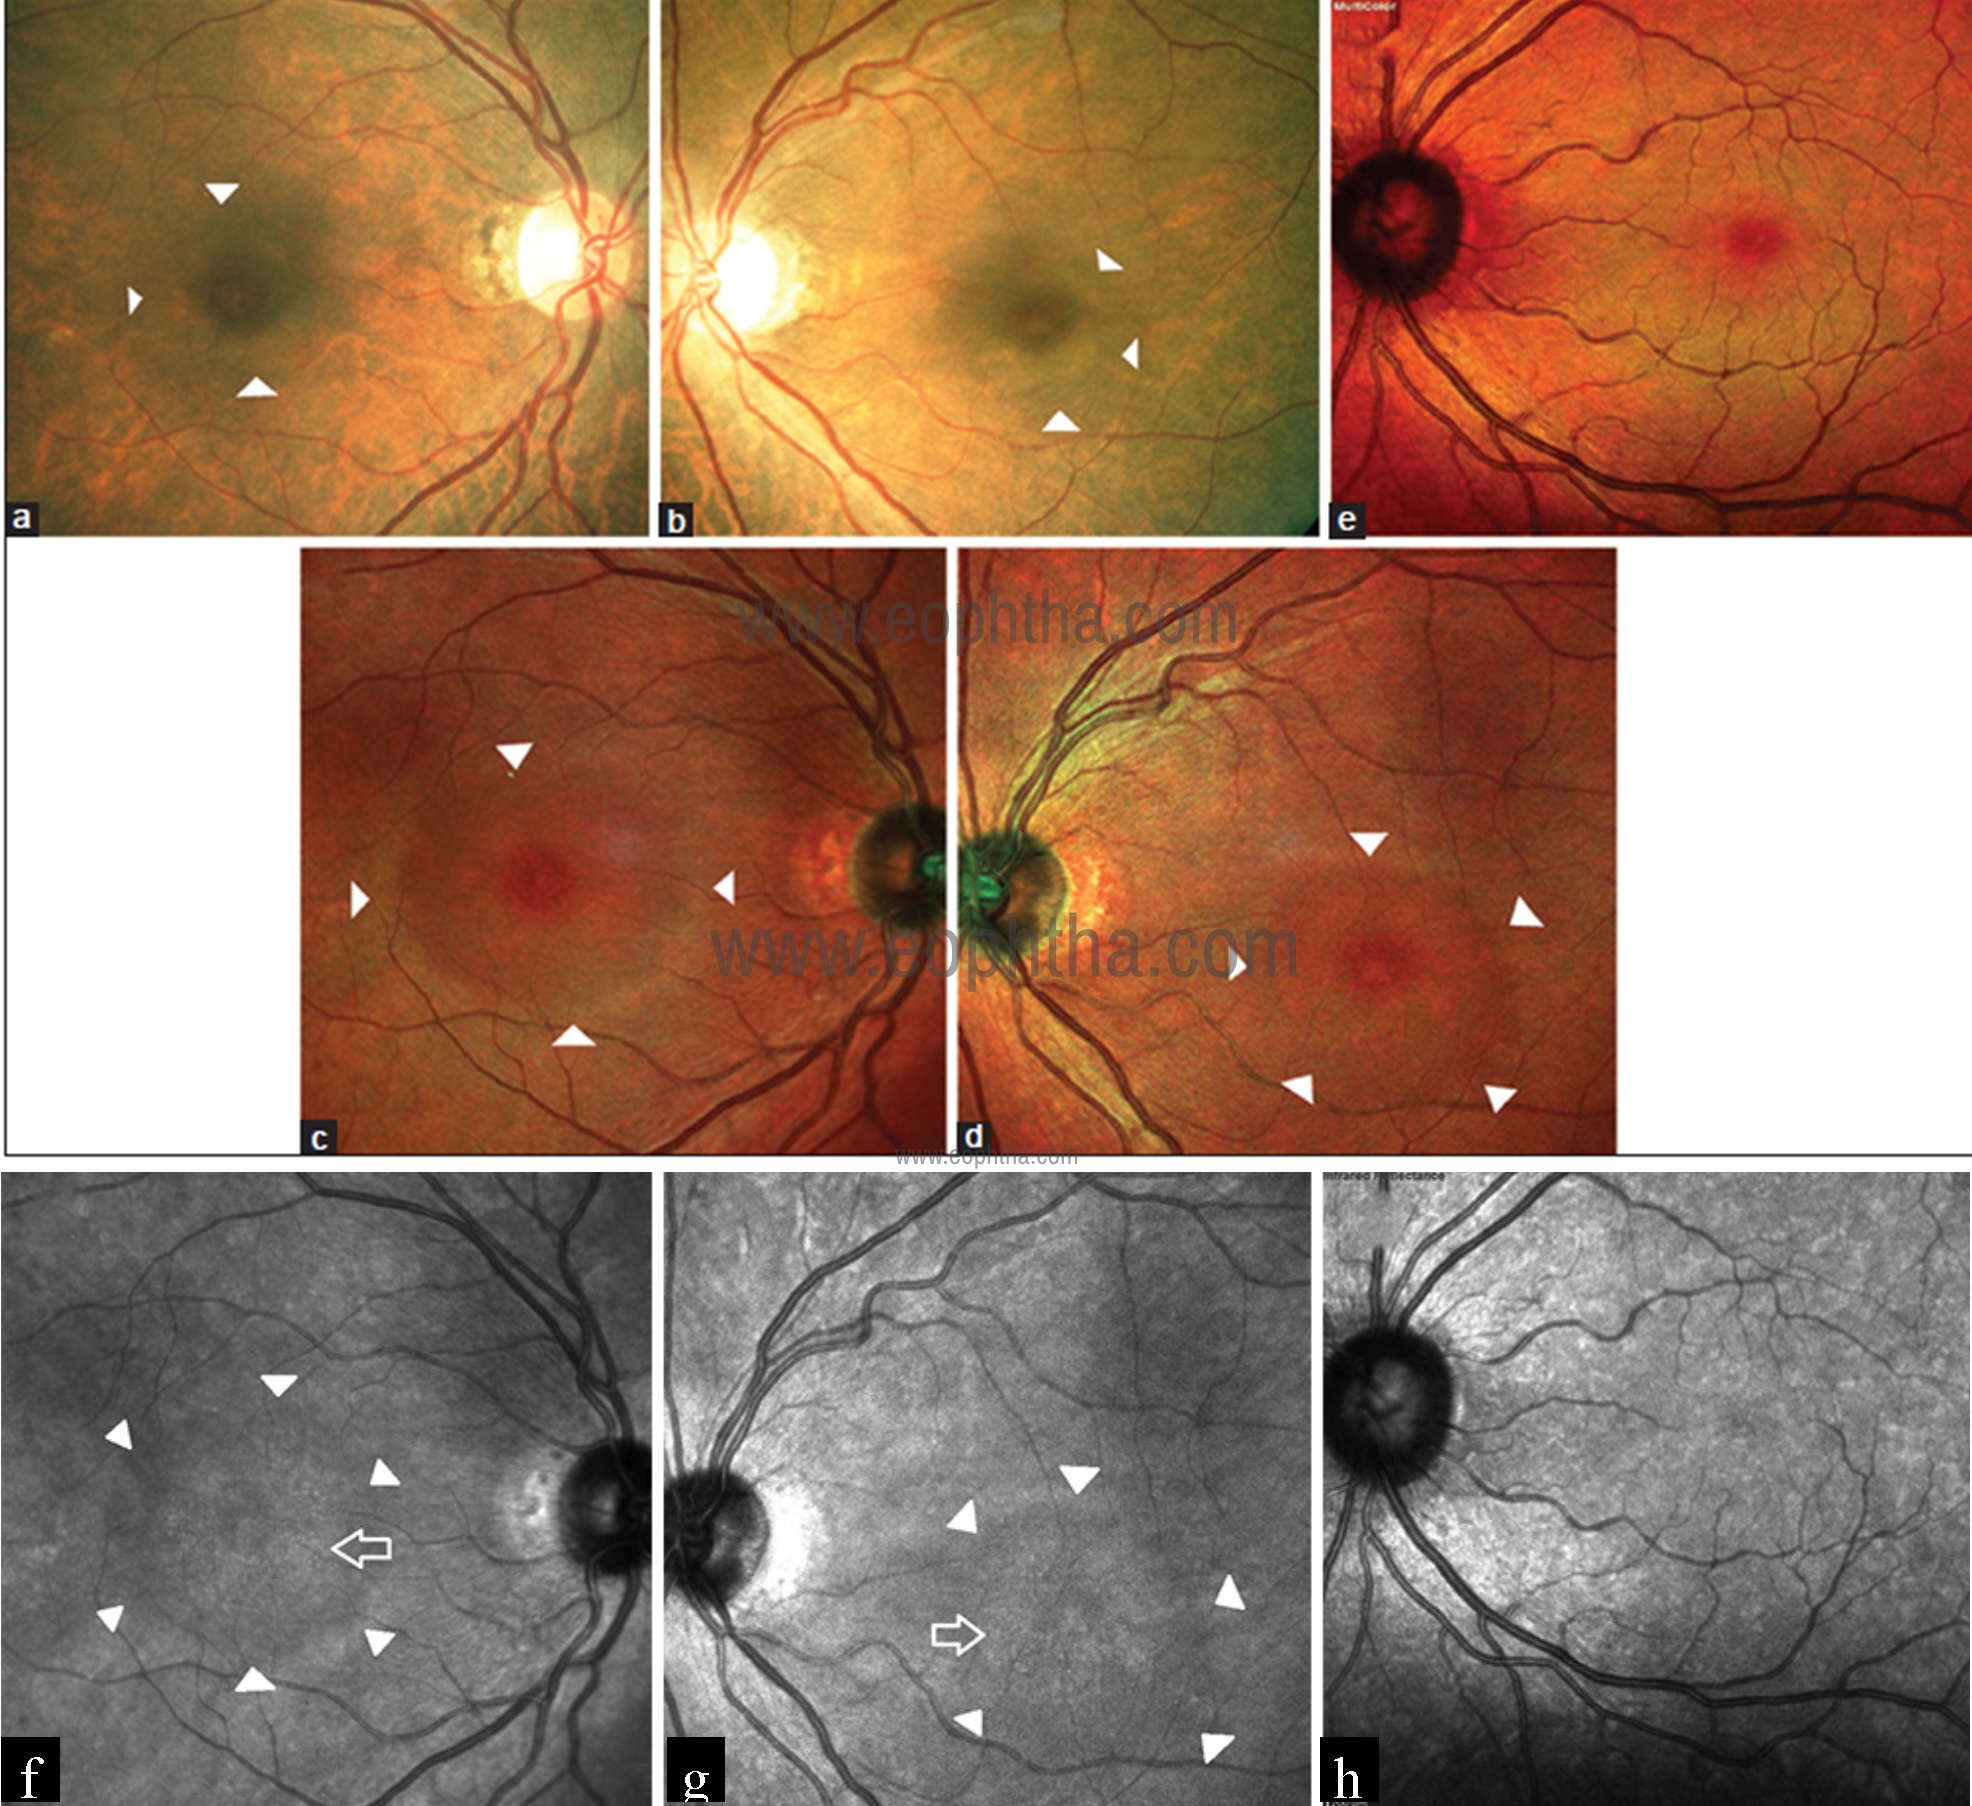
Fig 20: CFP of the right and left eye (a and b) show arcuate zone of hypopigmentation (white arrowheads) superior, temporal, and inferior to fovea. Multicolor images (c and d) of the right and left eye show ring of darker hue around fovea (white arrowheads) corresponding to the arcuate hypopigmentation seen on CFP and extending beyond. Multicolor image of the left eye (e) of a normal individual shows deep pink center of the fovea surrounded by a greenish hue corresponding which is missing in the eye with hydroxychloroquine retinal toxicity. IR images of the right and left eye (f and g) shows speckled hyperreflectance at the center of macula (blank white arrow). This area is surrounded by an arcuate zone of hyporeflectance (white arrowheads). IR image of the left eye (h) of a normal individual for comparison shows nondescript pattern of hypo and hyperreflectance at the macula; devoid of any arcuate zone as seen in hydroxychloroquine retinal toxicity eyes.
Hydroxychloroquine toxicity
Hydroxychloroquine (HCQ) retinal toxicity is known to cause irreversible vision loss and it is a progressive condition that progresses even after stopping the drug. Therefore, early detectionof toxicity is of utmost importance to prevent visual morbidity. Saurabh et al have described the utility of MCI in obviating the retinal changes in HCQ retinal toxicity better than conventional CFP.32 Composite multicolor image showed a circumscribed perifoveal arcuate area of darker hue sparing the fovea and IR image showed speckled hyperreflectance at the center of macula with an arcuate zone of hyporeflectance surrounding it (Fig 20). The larger area of retinal involvement could be appreciated in the multicolor image as compared to CFP.
Torpedo maculopathy
Torpedo maculopathy is a rare, congenital anomaly of RPE characterized by the appearance of a “torpedo‑shaped” lesion located temporal to the fovea. Venkatesh et al have reported multicolour imaging findings in Torpedo maculopathy. 33 MCI can be a useful tool in identifying the level of retinal and choroidal layer involvement in these patients.
Acute retinal pigment epitheliitis
Acute retinal pigment epitheliitis (ARPE) is a rare idiopathic inflammatory retinal disorder that causes dramatic vision loss, mainly in young adults. Clinical manifestations include central scotoma and pigment stippling in the macula surrounded by hypopigmented halos. Roy et al have reported MCI signature of ARPE. 34 ARPE lesion had a reddish color with inferior orange extension in multicolour composite image. The difference in color within same lesion could be attributed to differential topographical concentration and reflectance properties of the inflammatory debris of the ARPE lesion. The lesion could not be visualized in GR and BR imaging and was seen only in IR image, thus supporting the outer retinal origin of these lesions.
AMN
Acute macular neuroretinopathy (AMN) usually presents as brown‑red lesion near fovea and leads to variable disruption of photoreceptors seen as disruption of external limiting membrane and ellipsoid zone. Saurabh et al have reported MCI signatures in AMN. 35
Multicolor image showed a zone of pale‑pink discoloration with loss of perifoveal greenish hue. Infrared channel aimed at picking the outer retinal lesions showed zone of hyperreflectance (Fig 21). The pseudocolor encoding for this channel is red which explains the pinkish discoloration of lesion amidst the greenish perifoveal hue on multicolor image.
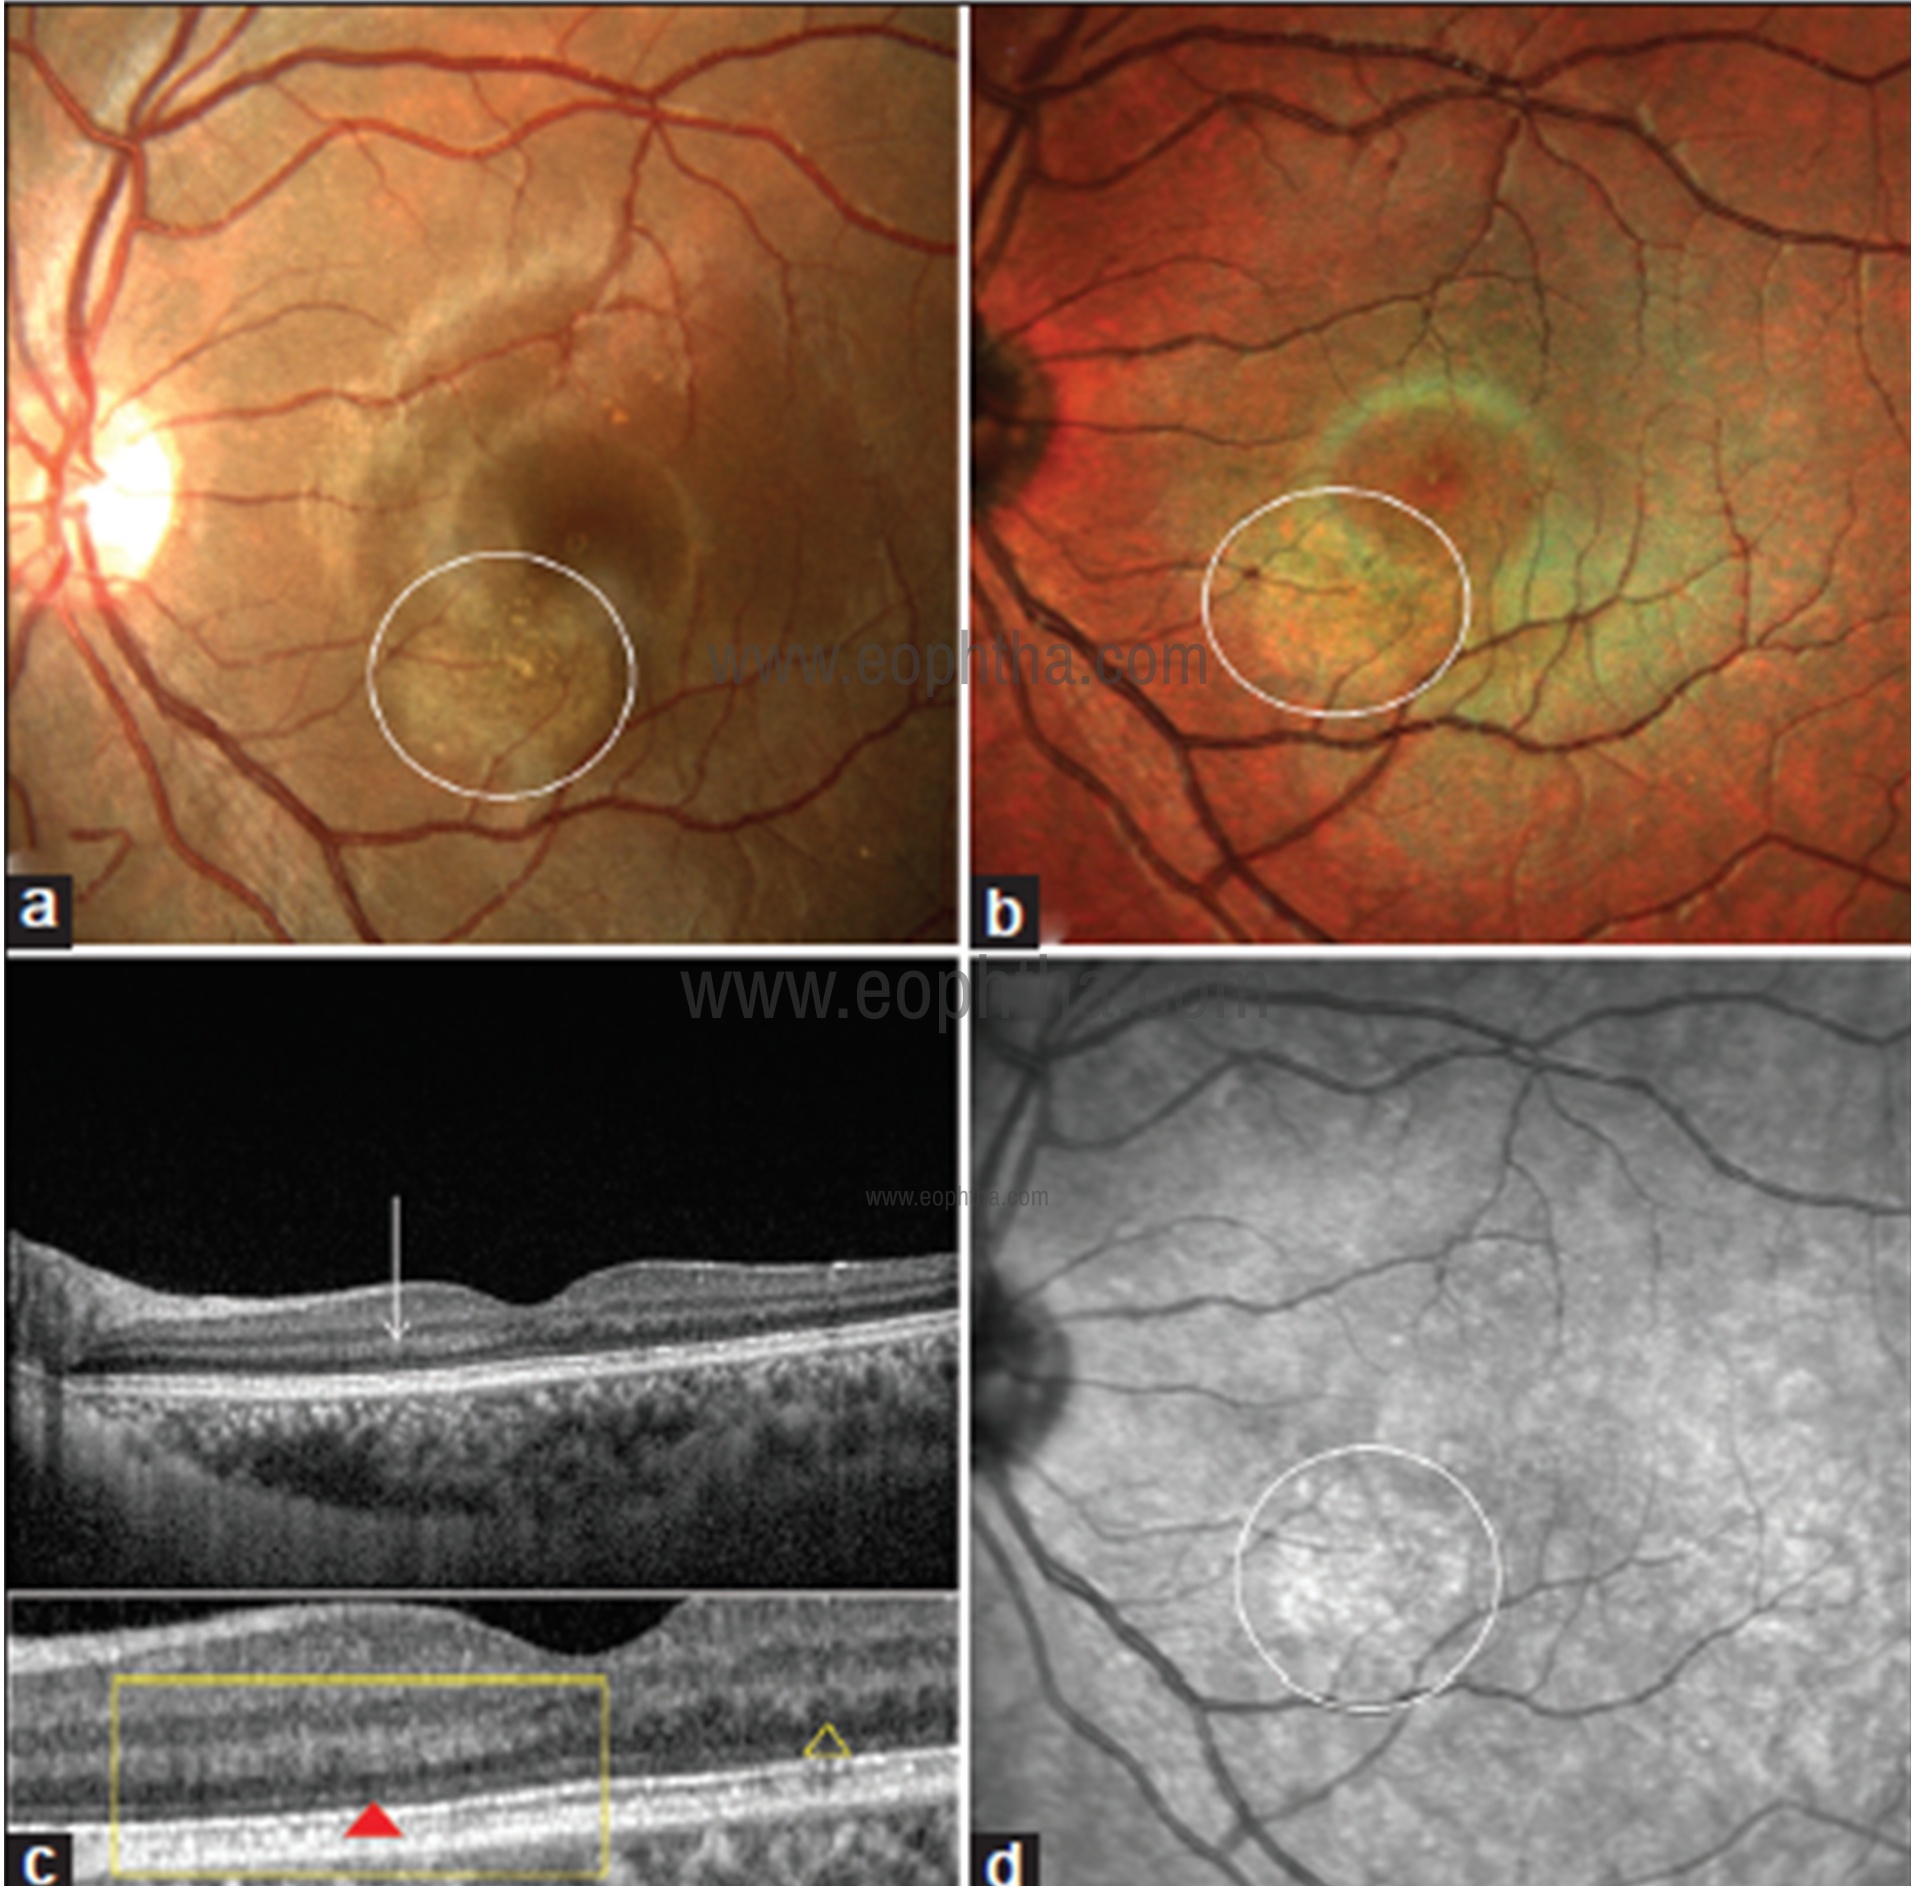
Fig 21: CFP of left eye (a) showing an area of yellowish brown depigmentation inferonasal to fovea (white circle); multicolor composite image (b) showing loss of perifoveal greenish hue over the area of acute macular neuroretinopathy lesion along with pinkish discoloration (white circle); line scan SDOCT image (c) through the lesion showing thickening of outer plexiform layer (OPL) on the nasal side of fovea compared with the temporal side (white arrow). The difference in the OPL thickness can be clearly made out in blown up image in the lower panel (yellow rectangle) comparing with the temporal OPL (yellow triangle). Note the subtle zone of discontinuity of external limiting membrane beneath the thickened OPL (red triangle) and thinning of outer nuclear layer; IR image (d) showing hyperreflectance corresponding to the AMN lesion (white circle).
Angioid streaks
Angioid streaks are irregular crack-like dehiscences in Bruch’s membrane that are often associated with atrophic degeneration of the overlying RPE.36 These can occur in isolation or in association with systemic diseases like Pseudoxanthoma elasticum, Paget disease, sickle cell trait disease and thalassemias. MCI highlights angioid streaks as a dark orange color. These are better visualized in IR as compared to GR and BR. Associated complications like CNV are better seen on MCI (Fig 22).
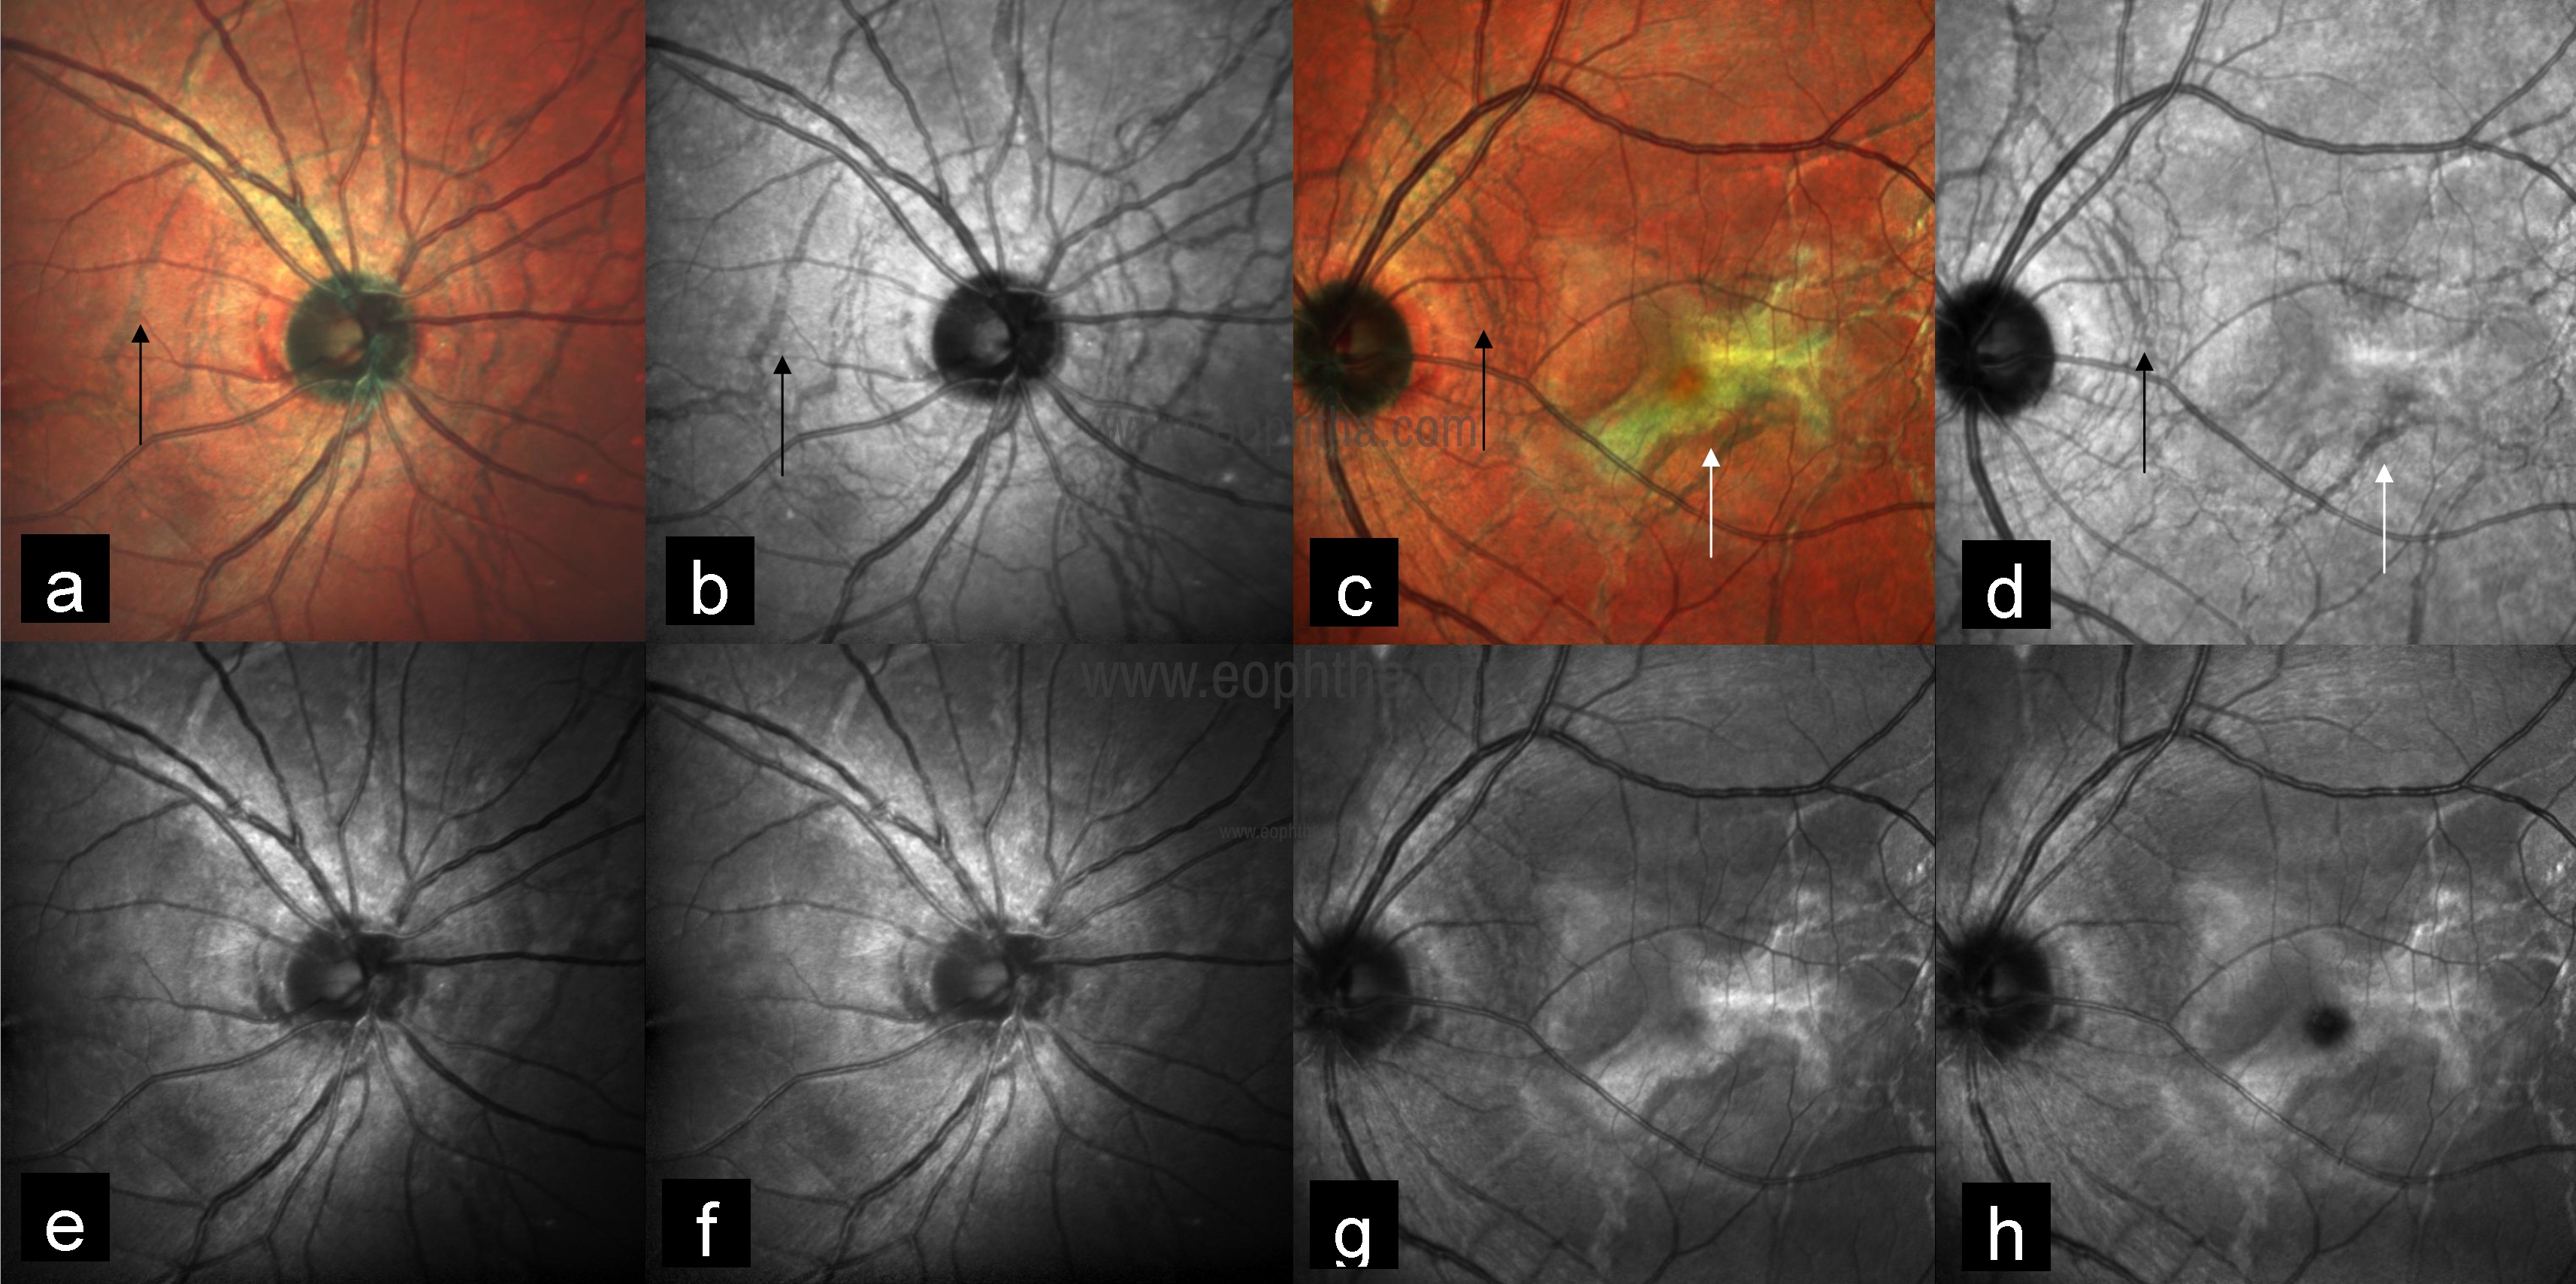
Fig 22: Multicolor image of both eyes highlights angioid streaks as dark orange color (a and c) (black arrows) and better visualized in IR (b and d) (black arrows) as compared to GR (e and g) and BR (f and h). Multicolor image of the left eye showing CNV as greenish color (c) (white arrow) with corresponding IR (d), GR (g), and BR (h) images.
Retinochoroidal coloboma
Retinochoroidal colobomas are congenital and usually asymptomatic. They are usually located in the mid-periphery away from the macula or the optic disc. Complications may occur leading to diminished visual acuity, especially when they involve the macula or optic
disc. Patients are at risk of rhegmatogenous retinal detachment because of retinal breaks located outside the area of the coloboma, inside the anomalous retinal tissue within the coloboma, or both. The most common site for the break and retinal detachment has been reported to be the neurosensory retina within the coloboma (referred to as intercalary membrane).37 Goel et al. have reported the utility of MCI in picking up intercalary membrane detachment (Fig 23).38
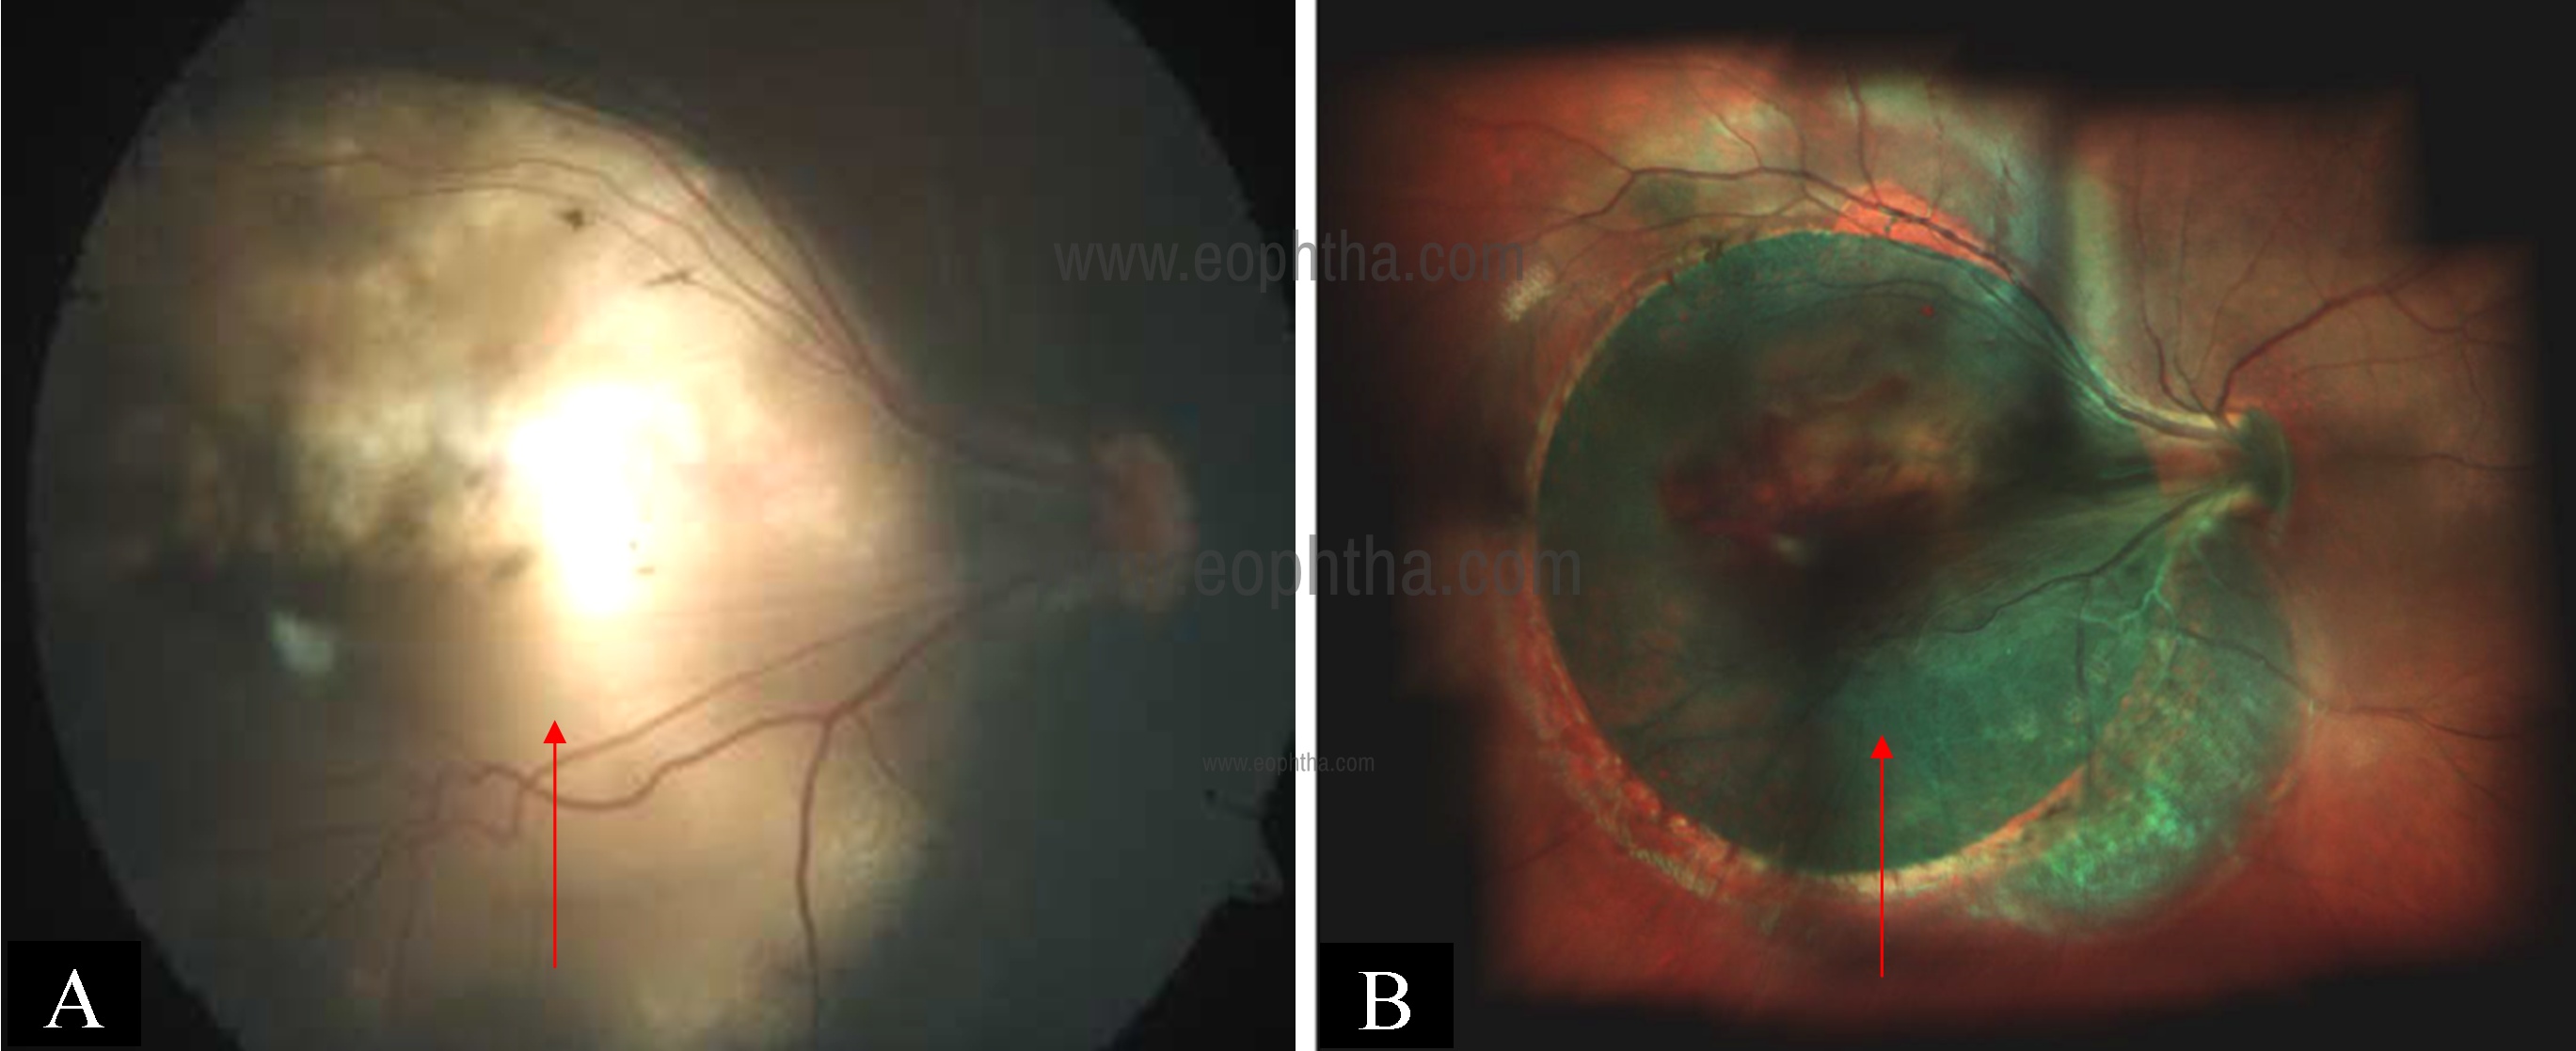
Fig 23: CFP of the right eye (a) showing macular coloboma (arrow). Multicolor image (b) showing greenish hue in the macular area suggestive of coloboma with intercalary membrane detachment (arrow) which could not be seen on CFP.
Retinal astrocytoma
Retinal astrocytomas are benign, glial tumors of the retinal nerve fiber layer that arise from retinal astrocytes. They may be associated with tuberous sclerosis, neurofibromatosis, or can also be found incidentally as an isolated presentation.39 Multicolor imaging with its component images highlight extent of the lesion (IR) and internal character like calcification (GR and BR) excellently (Fig 24).40
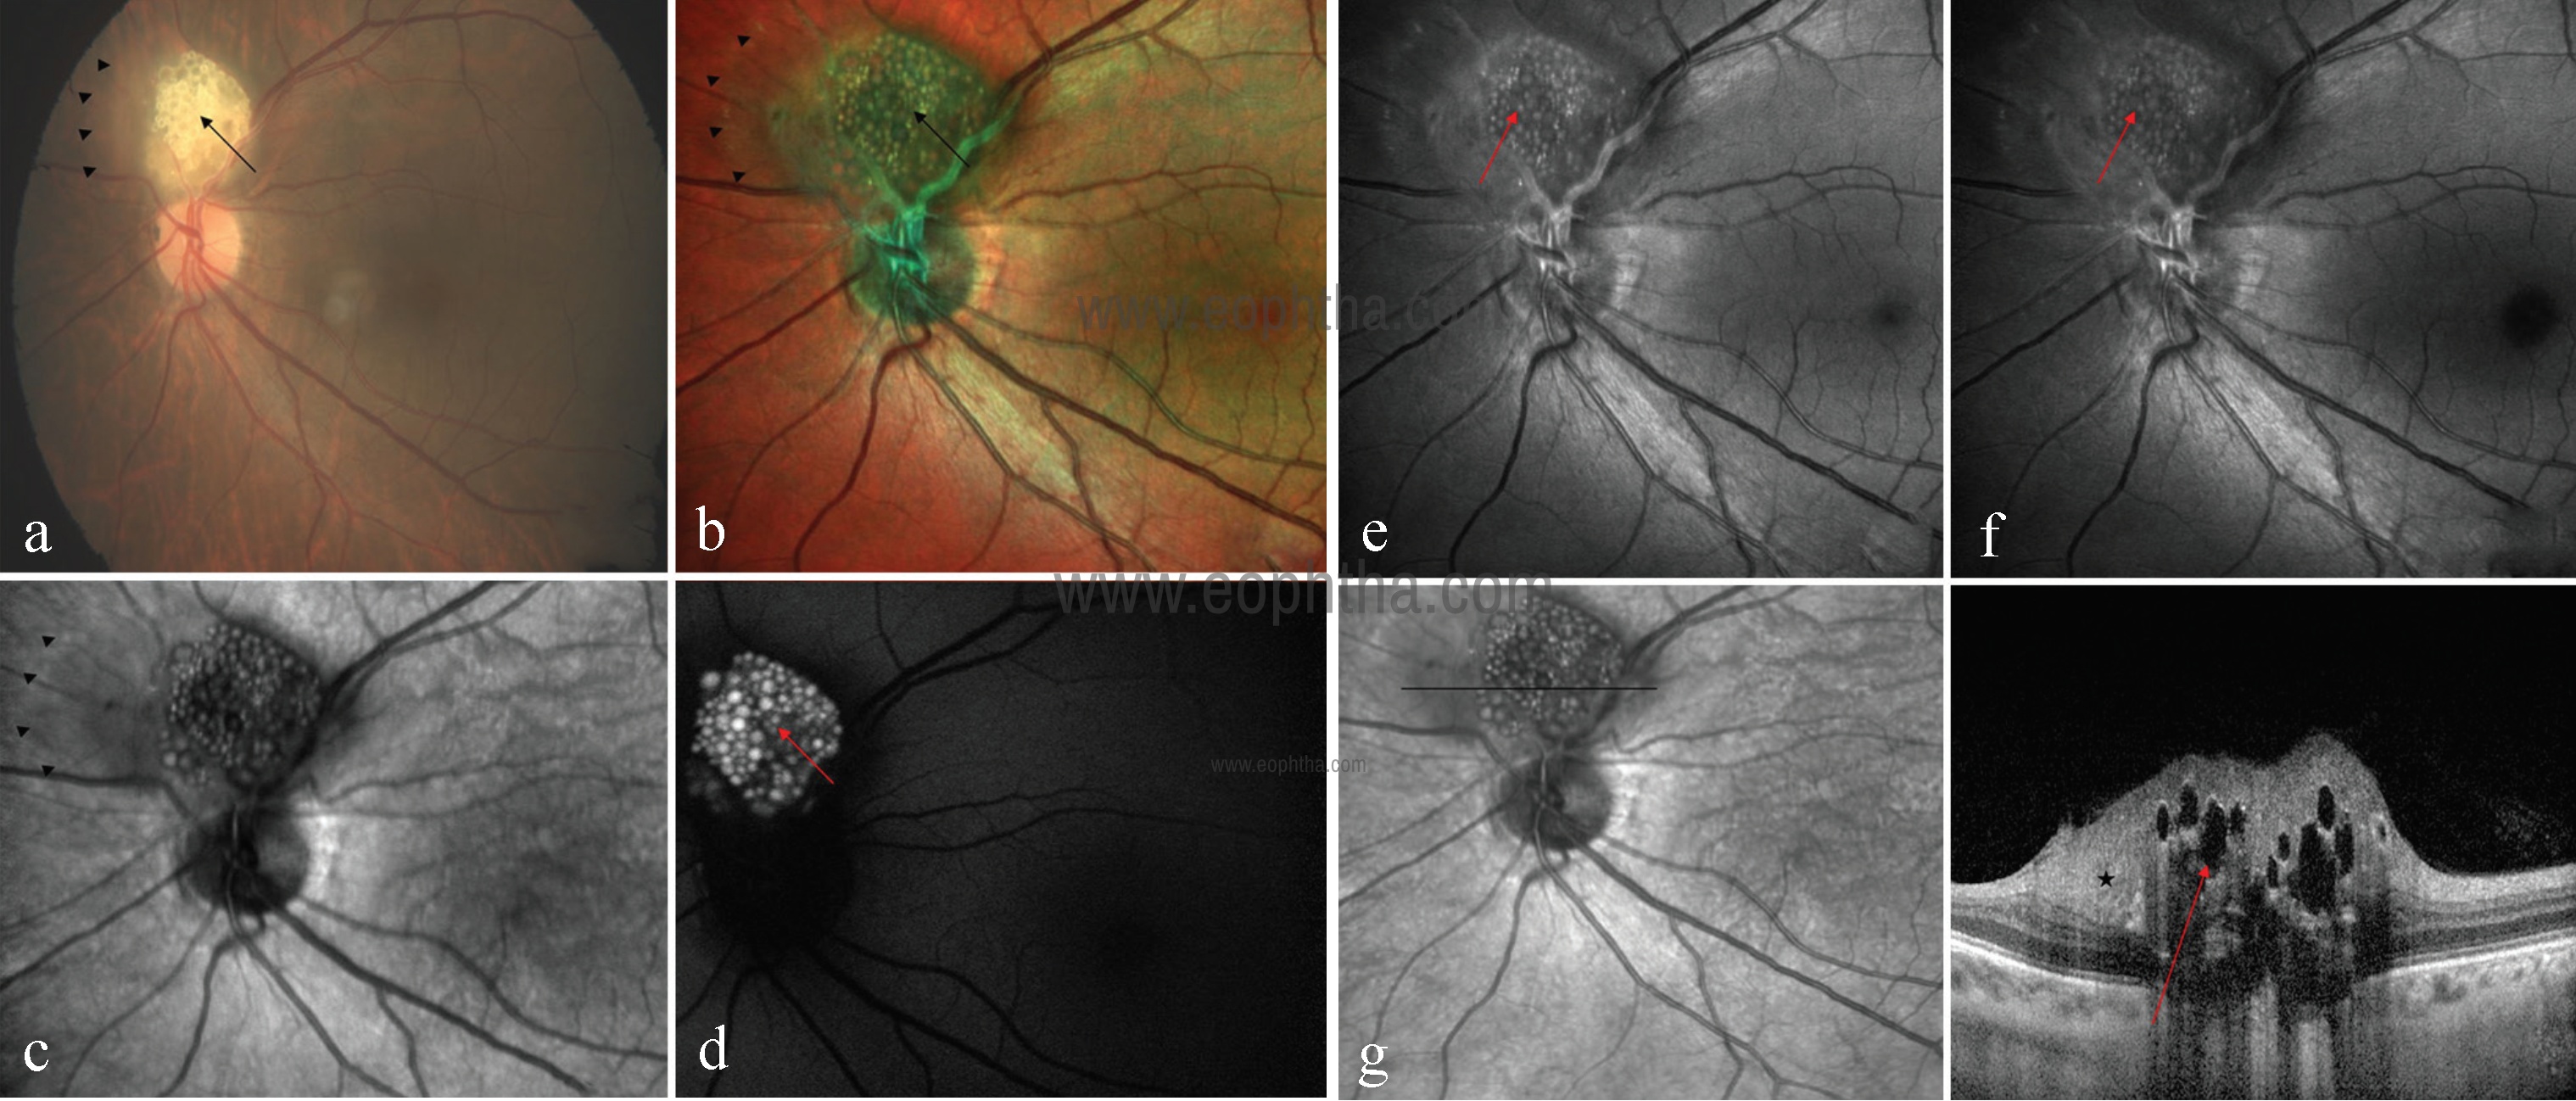
Fig 24: CFP of left eye (a) showing creamy white, semi-translucent, well-circumscribed, elevated lesion superior to the optic disc (black arrow). Multicolor image (b) highlights mulberry appearance of the lesion (black arrow) and green shift corresponding to entire extent of tumor mass (arrowheads). In IR (c), lesion is hyporeflective with its margins well delineated (arrowheads). Fundus autofluorescence (d) shows typical hyperautofluorescence. GR (e) and BR (f) highlight calcification as multiple hyperreflective dots (red arrows). SDOCT (g) showing moth-eaten optically empty spaces (red arrow) and area of retinal thickening adjacent to the elevated lesion (star).
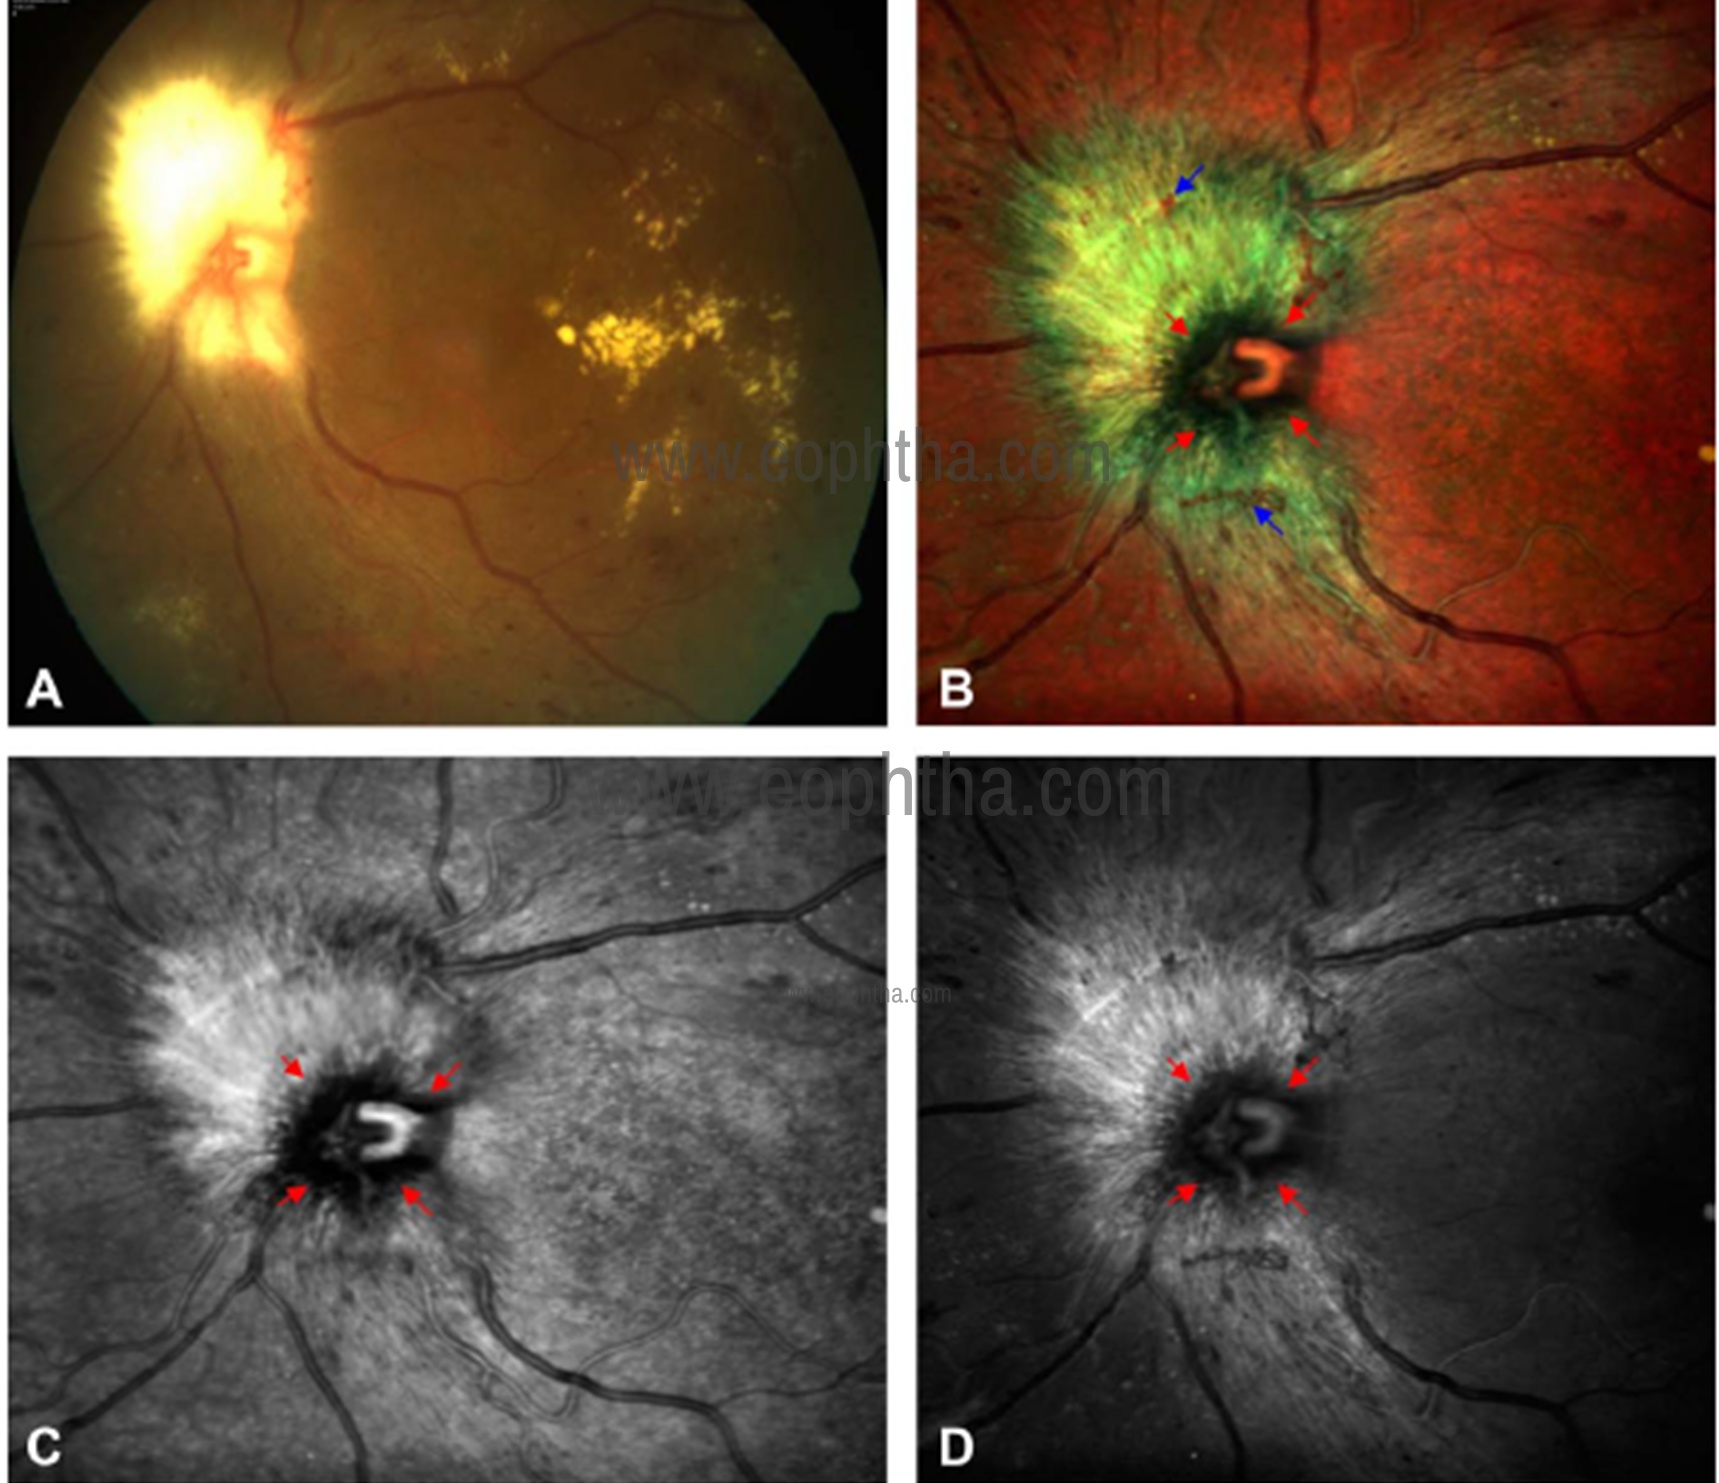
Fig 25: CFP of left eye (a) shows myelinated nerve fiber (MNF) in contiguity with the optic disc. The optic disc margins are difficult to delineate. Optic disc margins (red arrows) are well delineated from surrounding MNF (greenish hue) in multicolor image (b). Disc margin hemorrhages (blue arrows) can only be visualized in multicolor image and are not well seen in CFP. Optic disc margins (arrows) are better visualized in using IR (c) as compared to GR (d).
Myelinated nerve fibers
Myelinated nerve fibers (MNF) are characterized as whitish, relatively sharply demarcated, feather-like structures located in the retinal nerve fiber layer (RNFL). MNF are located quite frequently in contiguity with the optic nerve head. This may lead to a diagnostic dilemma by preventing clear visualization of the optic disc margins. MNF lead to RNFL thickening that is detected by confocal imaging of MCI. MNF appears greenish or greenish orange on multicolor image (Fig 25). This variation in appearance is due to the amount of retinal thickening. Among the component channels, the IR channel is better for identifying retinal thickening. This may be due to the high melanin content of MNF. Multicolor image and IR image are superior to CFP in delineating disc margins and identifying additional lesions such as disc margin hemorrhages.41
Choroidal disorders:
Role of MCI in various choroidal disorders has been described in literature. MCI can be used for accurate documentation and detection of changes in the appearance and size of the lesion over time. Saurabh et al have reported superiority of MCI compared to CFP in measurement of size of pigmented choroidal nevus.42 Muftuoglu et al compared the characteristics of the retinal and choroidal lesions including choroidal nevus, choroidal melanoma and congenital hypertrophy of the RPE using conventional CFP and MCI. They found out that MCI is a useful tool to detect the characteristics of the choroidal and retinal pigmentary lesions including border, halo and drusen.43 Kaprinis et al have described the principle characteristics of combined hamartoma of the retina and RPE on MultiColorTM imaging and evaluate its role as a diagnostic and management tool.44 They concluded that MultiColorTM and IR define tumour boundaries and macular involvement, which may be useful for assessing visual impact and GR highlights inner retinal distortion, which may aid surgical management decisions. Venkatesh et al have reported MCI in choroidal osteoma.45 Change in reflectance of the IR and multicolor images can be used as an indicator to assess the extent of tumour decalcification and its secondary changes and can aid in prognosis.
Optic nerve head disorders:
Glaucoma is a progressive optic neuropathy associated with irreversible loss of retinal ganglion cells. The localized RNFL defect can be the earliest sign to detect the ongoing glaucomatous damage. MCI highlighs the RNFL defect as a wedge defect with loss of greenish hue in contrast to greenish hue emanating from intact RNFL. It is better seen on GR and BR as compared to conventional color and red‑free photograph and appear as a hyporeflectant wedge.46 Interpretation of optic disc cupping and neuroretinal rim is challenging in myopic eyes because of large, shallow and tilted disc, myopic crescent, and macular degeneration. Multicolor optic disc photography is able to delineate the neuroretinal rim and optic cup more clearly than color and red‑free optic disc photographs.47
MCI has a role in differentiating optic disc edema (ODE) from pseudo optic disc edema (PODE). Composite multicolor images of the disc in ODE show greenish hyperreflectance that extends beyond the optic disc margins with irregular blurry margins and obscured disc vasculature as it is invariably associated with peripapillary RNFL edema whereas PODE shows a greenish hyperreflectance with clear and distinct margins and well delineated disc vasculature.48 Utility of MCI has been described in optic disc pit maculopathy.49 Optic disc pit is a rare cavitary lesion of the optic nerve. Optic disc pit maculopathy is characterised by retinoschisis, serous macular detachment and atrophy of the retina. This condition can present as a diagnostic dilemma if the pit is not discernible clinically or on CFP.
Kumar et al have reported the efficacy of MCI in patients with asteroid hyalosis. MCI can obviate the difficulties with CFP in these patients and provide clinicians a simpler way to assess the retina.
MCI has some disadvantages when compared to conventional CFP. MCI may require a slightly longer period of fixation to take the three separate images and artifacts must be taken into consideration. Clinicians should be familiar with variations in the color produced in MCI. In conclusion, MCI is a useful modality to assess posterior segment lesions and may be used to replace CFP in some diseases.
References:
- Tan AC, Fleckenstein M, Schmitz-Valckenberg S, et al. Clinical application of multicolor imaging technology. Ophthalmologica 2016;236:8–18.
- Sergott RC. Retinal segmentation using multicolor laser imaging.J Neuroophthalmol. 2014;34 Suppl:S24-S28.
- Roy R, Saurabh K, Thomas NR, et al. Validation of Multicolor Imaging of Diabetic Retinopathy Lesions Vis a Vis Conventional Color Fundus Photographs.Ophthalmic Surg Lasers Imaging Retina. 2019;50(1):8-15.
- Arrigo A, Teussink M, Aragona E,et al.MultiColor imaging to detect different subtypes of retinal microaneurysms in diabetic retinopathy. 2020. Eye. https://doi.org/10.1038/s41433-020-0811-6.
- Goel S, Garg B, Shah AV, et al. Multicolor imaging in neovascularization of disc. Indian J Ophthalmol. 2019 Mar;67(3):408.
- Saurabh K, Roy R, Goel S. Correlation of multicolor images and conventional color fundus photographs with foveal autofluorescence patterns in diabetic macular edema. Indian J Ophthalmol. 2020;68(1):141-144.
- Ahmad MSZ, Carrim ZI. Multicolor Scanning Laser Imaging in Diabetic Retinopathy.Optom Vis Sci. 2017;94(11):1058-1061.
- Goel S, Saurabh K, Roy R. Combined central retinal vein occlusion and branch retinal artery occlusion. Indian J Ophthalmol. 2018 Dec;66(12):1862-1863.
- Schouten I, Goel S, Saurabh K, et al. Multicolour imaging signatures to diagnose concurrent macular telangiectasia type 2 and macular branch retinal vein occlusion.GMS Ophthalmol Cases. 2019;9:Doc36.
- Ben Moussa N, Georges A, Capuano V, et al. MultiColor imaging in the evaluation of geographic atrophy due to age-related macular degeneration.Br J Ophthalmol. 2015;99(6):842-847.
- Mishra S, Goel S, Roy SS, et al. Multimodal imaging characteristics of refractile drusen. Indian J Ophthalmol. 2019 Jan;67(1):128-129.
- Badal J, Biarnés M, Monés J. Performance characteristics of multicolor versus blue light and infrared imaging in the identification of reticular pseudodrusen.Int Ophthalmol. 2018;38(1):199-206.
- Venkatesh R, Pereira A, Thomas S, et al. Subretinal drusenoid deposits versus drusen on multicolor imaging. Indian J Ophthalmol 2020;68:1450-1.
- Tan CS, Ting DS, Lim LW. Multicolor Fundus Imaging of Polypoidal Choroidal Vasculopathy.Ophthalmol Retina. 2019;3(5):400-409.
- Tan ACS, Yanagi Y, Cheung GCM. COMPARISON OF MULTICOLOR IMAGING AND COLOR FUNDUS PHOTOGRAPHY IN THE DETECTION OF PATHOLOGICAL FINDINGS IN EYES WITH POLYPOIDAL CHOROIDAL VASCULOPATHY [published online ahead of print, 2019 Aug 27].Retina. 2019;10.1097/IAE.0000000000002638. doi:10.1097/IAE.0000000000002638
- Feng HL, Sharma S, Asrani S, et al. MULTICOLOR IMAGING OF INNER RETINAL ALTERATIONS AFTER INTERNAL LIMITING MEMBRANE PEELING.Retin Cases Brief Rep. 2017;11(3):198-202.
- Saurabh K, Roy R, Mishra S, et al. Multicolor imaging features of dissociated optic nerve fiber layer after internal limiting membrane peeling. Indian J Ophthalmol 2018;66:1853-4.
- Charbel Issa P, Berendschot TTJM, Staurenghi G,et al. Confocal blue reflectance imaging in type 2 idiopathic macular telangiectasia. Invest Ophthalmol Vis Sci 2008;49:1172–1177.
- Charbel Issa P, Finger RP, Helb HM, et al. A new diagnostic approach in patients with type 2 macular telangiectasia: confocal reflectance imaging. Acta Ophthalmol 2008;86:464–465.
- He L, Chen C, Yi Z, et al. Clinical application of multicolor imaging in central serous chorioretinopathy. Retina 2018. doi: 10.1097/IAE.0000000000002441.
- Venkatesh R, Agarwal SK, Bavaharan B, et al. Multicolour imaging in central serous chorioretinopathy. Clin Exp Optom 2019. doi: 10.1111/cxo. 12965.
- Saurabh K, Roy R, Goel S, et al. Validation of multicolor imaging signatures of central serous chorioretinopathy lesions vis-a-vis conventional color fundus photographs. Indian J Ophthalmol 2020;68:861-6.
- Kilic Muftuoglu I, Bartsch DU, Barteselli G, et al. Visualization of macular pucker by multicolour scanning laser imaging. Retina 2018;38:352‑8.
- Song JH, Moon KY, Jang S, et al. Comparison of MultiColor fundus imaging and colour fundus photography in the evaluation of epiretinal membrane.Acta Ophthalmol. 2019;97(4):e533-e539.
- Saurabh K, Roy R, Thomas NR. Multicolor imaging characteristics of Best’s vitelliform macular dystrophy. Middle East Afr J Ophthalmol 2019;26:178-80.
- Shah D, Saurabh K, Roy R. Multimodal imaging in Multifocal Best disease. Indian J Ophthalmol 2018;66:1313-5.
- Cicinelli MV, Battista M,Starace V, et al. Monitoring and Management of the Patient with Stargardt Disease. Clin Optom (Auckl). 2019; 11: 151–165.
- Roy R, Saurabh K, Shah D. Multimodal Imaging in a Case of Fundus Pulverulentus.Retina. 2018;38(7):e55-e58.
- Roy R, Saurabh K, Bhattacharyya S, et al. Multimodal imaging in dominant cystoid macular dystrophy.Indian J Ophthalmol.2017;65:865–6
- Liu G, Du Q, Keyal K, et al. Morphologic characteristics and clinical significance of the macular-sparing area in patients with retinitis pigmentosa as revealed by multicolor imaging. Exp Ther Med. 2017 Dec; 14(6): 5387–5394.
- Goel S, Saurabh K, Roy R. Multimodal imaging in a case of choroideremia. Indian J Ophthalmol 2019;67:1470-1.
- Saurabh K, Roy R, Thomas NR, et al. Multimodal imaging characteristics of hydroxychloroquine retinopathy. Indian J Ophthalmol 2018;66:324-7.
- Venkatesh R, Bavaharan B, Yadav NK. Multicolor imaging findings in torpedo maculopathy. Indian J Ophthalmol 2019;67:295-7.
- Roy R, Saurabh K, Thomas NR. Multicolor imaging in a case of acute retinal pigment epithelitis.Retin Cases Brief Rep.2018;0:1–4.
- Saurabh K, Roy R, Shah D, et al. Multimodal imaging characteristics of acute macular neuroretinopathy. Indian J Ophthalmol 2019;67:403-4.
- Georgalas I, Papaconstantinou D, Koutsandrea C, et al. Angioid streaks, clinical course, complications, and current therapeutic management. Ther Clin Risk Manag 2009;5:81–89.
- Gopal L, Badrinath SS, Sharma T, et al. Pattern of retinal breaks and retinal detachments in eyes with choroidal coloboma. Ophthalmology 1995; 102:1212–1217.
- Goel S, Saurabh K, Roy R. Multicolour imaging in retinochoroidal coloboma [published online ahead of print, 2019 Dec 5].Clin Exp Optom. 2019; 10.1111/cxo.13026.
- Ulbright TM, Fulling KH, Helveston EM. Astrocytic tumors of the retina. Differentiation of sporadic tumors from phakomatosis‑associated tumors. Arch Pathol Lab Med 1984;108:160-3.
- Goel S, Das D, Saurabh K, et al. Multicolor imaging in retinal astrocytoma. Indian J Ophthalmol. 2019 Jul;67(7):1167-1168.
- Bhattacharya S, Goel S, Saurabh K, et al. Multicolor Imaging of Myelinated Nerve Fibers Contiguous to the Optic Disc.J Neuroophthalmol. 2020;40(1):104-105.
- Saurabh K, Roy R, Sinharoy S, et al. Measurement of size of pigmented choroidal nevus: Superiority of multicolor imaging compared to conventional color fundus photography. Indian J Ophthalmol 2018;66:1501-3.
- Muftuoglu IK, Gaber R, Bartsch DU, et al. Comparison of conventional color fundus photography and multicolor imaging in choroidal or retinal lesions.Graefes Arch Clin Exp Ophthalmol. 2018;256(4):643-649.
- Kaprinis K, Bobat H, De Salvo G. MultiColorTMimaging in combined hamartoma of the retina and retinal pigment epithelium.Eye (Lond). 2018;32(9):1478-1482.
- Venkatesh R, Bavaharan B, Yadav NK, et al. Multicolor imaging in choroidal osteomas.Int J Retina Vitreous. 2018;4:46. Published 2018 Dec 13.
- Basu T, Shah D, Das D, et al. Multicolor imaging for retinal nerve fiber layer defect in glaucoma. Indian J Ophthalmol 2018;66:1345-9.
- Basu T, Garg B, Mishra S, et al. Utility of multicolor optic disc photography in evaluation of glaucomatous optic disc in myopic eyes: A novel approach. Indian J Ophthalmol 2019;67:412-4.
- Thomas NR, Ghosh PS, Chowdhury M, et al. Multicolor imaging in optic disc swelling. Indian J Ophthalmol 2017;65:1251-5.
- Saurabh K, Roy R, Shah D, et al. Multicolour imaging in a patient with optic disc pit maculopathy. Clin Exp Optom 2018;101:805‑6.
- Saurabh K, Roy R, Chowdhury M. Efficacy of multicolor imaging in patients with asteroid hyalosis: Seeing the unseen.JAMA Ophthalmol. 2018;136(4):446-447.