
Fundus Fluorescein Angiography (FFA) is still a gold standard investigation, for studying the circulation of the retina and partly choroid and highlights the dynamic interaction of the dye with the same. Many adjunct investigations like Optical Coherence Tomography (OCT), Fundus autofluorescence (FAF), Optical Coherence Tomography Angiography (OCTA), etc. help in retinal diagnosis and management, but FFA still remains indispensable. The procedure is relatively simple, involving serial photographs of the fundus, after injecting sodium fluorescein intravenously. However, the information given is immense, and proper interpretation requires a good understanding of retinal anatomy. This article aims at a better understanding of the FFA pictures on digital capture, which is mostly used now as against the old film-based technique.
1. Differentiating pseudofluorescence from true fluorescence
The excitation and the barrier filter play a very important role in the interpretation of the FFA pictures. The attrition of these filters can lead to improper excitation or interference with the capture of proper fluorescence. Pseudofluorescence refers to fluorescence captured before injecting the dye due to mismatched filters. Hence, a control picture before the dye injection must be captured to reveal pseudo fluorescence.
Timing the various phases of the angiogram
The next step is extracting information, from the various stages of retinal angiogram - Choroidal flush, arterial phase, arteriovenous transit phase, venous phase, and the late phase. Observation of their timing gives valuable details.
2. Choroidal flush:
It is generally patchy, depicting the lobules, due to the normal leakage from the choriocapillaris and is visible as deep diffuse background fluorescence. It is absent in the macular area because the high concentration of xanthophyll and lipofuscin absorb the blue exciting light.
3. Arm to retina time/ Arterial phase:
It starts from the time injection is pushed via the antecubital vein and its first appearance in the retinal arteries. It is 8-12 seconds, 1-2 seconds after the choroidal flush, depending upon the speed of injection, age of the patient, and his cardiovascular status. The arterial tree fills up almost simultaneously and quickly and any delay in any segment means a vascular block.
4. AV transit time:
It is generally 10-15 seconds. It is the passage of the dye from pre-capillary arterioles to postcapillary venules, generally depicted as laminar flow. It is also called the peak phase of the angiogram because the concentration of fluorescein is maximum in both the choroid and retina. This is the best time to study the shape and size of thefoveal avascular zone (FAZ),(Fig. 1c) and hence both eyes must be photographed at this point of the angiogram, which is around 20- 25 seconds.
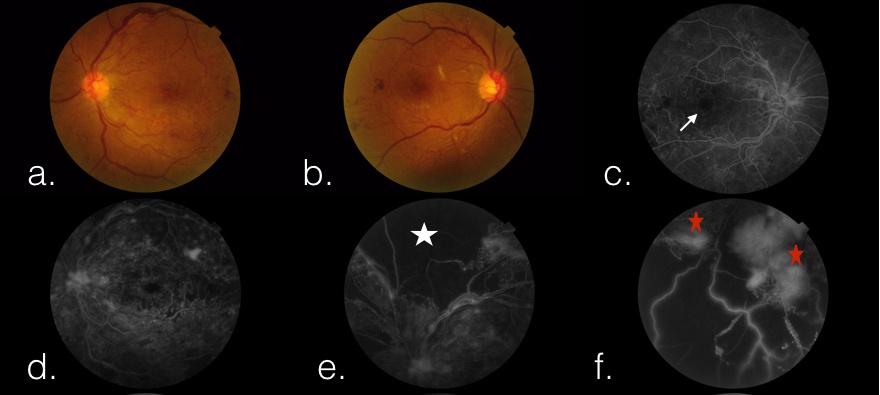
Figure 1 a. Color fundus picture of the left eye. b. Color fundus picture of the right eye. c. Fundus fluorescein angiogram (FFA) showing the foveal avascular zone (white arrow) in the right eye at peak phase of angiogram. The FAZ here is enlarged. e. The area of hypofluorescence (white star) is due to hypoperfusion denoting capillary non-perfusion (CNP).f. The hyper fluorescence area (red stars) shows leakage from the neovascularisation frond.
5. Venous phase:
The venous phase initiates as laminar flow, due to faster-moving plasma along the vessel wall and higher density erythrocytes slowly moving centrally. It takes around 10-25 seconds for the lumen of veins to fill completely.
6. Late phase:
Almost after a minute of initiation of the angiogram, the recirculation or the late phase of the angiogram begins and the fluorescence gradually starts declining. This period best highlights the late leakages of dye, any pooling of dye, or any staining of tissues. Optic disc stains normally in the late phase.
7. Identification of areas of abnormal fluorescence and to study their course during the angiogram:
Abnormal fluorescence can be of two types: hypofluorescence and hyper fluorescence. Not only do we identify these areas with abnormal fluorescence but we also need to study well the course of these areas, as the angiogram proceeds.
HYPOFLUORESCENCE is said when the fluorescence is lesser than normal or completely absent. A hypofluorescent area only means two things. Either there is REDUCED VASCULARITY (complete absence or delayed filling) (Fig. 1e) or the fluorescence is BLOCKED (Fig. 2b) by the overlying structures like hemorrhage, exudates, pigment, etc. This holds true for hypofluorescence of both choroid and retina. Depending upon what level of fluorescence is blocked, the level of the lesion can also be deciphered to be subretinal, intraretinal, or preretinal.
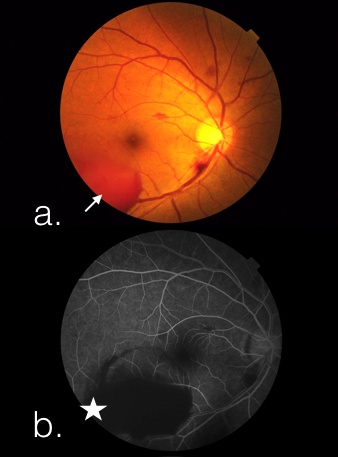
Figure 2. a. Color fundus picture of the right eye with subhyaloid haem (white arrow) b. FFA showing corresponding hypo fluorescence area implying blocked fluorescence (white star)
Choroidal hypofluorescence can occur due to either reduced vascularity as in embolism and is visible as a triangular filling defect, or absence of choroidal tissue as in congenital absence (coloboma), degeneration, trauma, etc. Both conditions can be easily differentiated clinically, as in the latter we can see sclera due to the absence of choroid.
HYPERFLUORESCENCE is an excess of normal fluorescence which can be leakage, staining, pooling, or a window defect. Though OCTA is proving to be an immensely useful tool in reading the vascular network of retina and choroid for all the above findings, the role of FFA is indispensable in particular.
LEAKAGE refers to the extravasation of the dye. It can happen due to the disruption of the blood-retinal barrier- both inner and outer. The other condition where the leakage is observed is neovascularization- both in the choroid and retina. Choroidal neovascularisation(CNVM) would fluoresce during the choroidal flush while retinal neovascularization at the disc(NVD) or elsewhere (NVE) would be visible only once dye reaches the retinal circulation. Leakage would show a gradual increase of fluorescence as the angiogram progresses and the borders eventually become fuzzy with late leakage. (Fig. 1f)
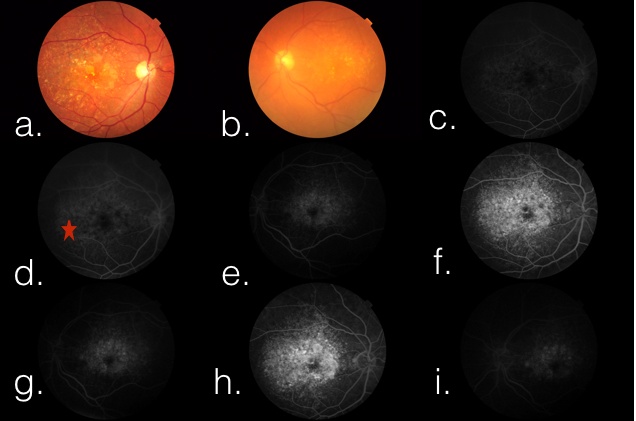
Figure3 a. Color fundus picture of the right eye. b. Color fundus picture of the left eye showing dry age-related macular degeneration (AMD- drusen with the area of geographic atrophy) c & e. FFA showing early hyper fluorescence (red star) due to transmission defect. The fluorescence is more pronounced due to the atrophy of overlying RPE. h & i: FFA showing late hyperfluorescence due to staining of drusens in the late phase.
WINDOW DEFECT (Fig. 3c) is seen in the area of RPE damage, where either the pigment is reduced or absent, resulting in enhanced visualization of underlying fluorescence. It has a uniform shape and size during the entire angiogram, while the brightness increases and then decreases like the normal angiogram. The borders of such defects are sharp. Conditions in which transmission defect is commonly seen include drusen, angioid streaks, geographic atrophy of macular degeneration, and full-thickness macular holes.
POOLING (Fig. 4f) refers to the accumulation of dye in an anatomic space. It can be in subretinal space or sub RPE space. Sub RPE detachments usually have distinct borders while the subretinal has diffuse borders. The dye highlights the space well and persists in the late phase.
STAINING (Fig. 3h) refers to the accumulation of dye in a tissue. it is usually seen in the late phase and in lesions like drusen, chorioretinal scars, etc. In a normal situation, the optic disc shows some late staining in the sclera.
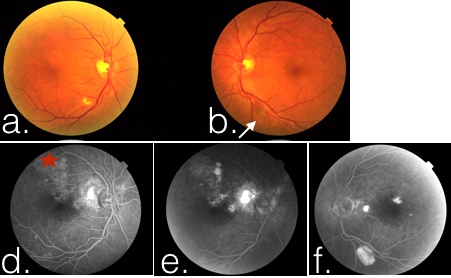
Figure 4 a. Color fundus picture of the right eye. b. Color fundus picture of the left eye showing pigment epithelial detachment (PED- white arrow).d & e. FFA showing early hyper fluorescence (red star) due to transmission defect. The fluorescence is more pronounced due to atrophy of overlying RPE. f. FFA showing late hyperfluorescence due to pooling in the PED
8. Abnormal vasculature:
Since an angiogram particularly helps in understanding the vasculature, let's see the findings in the case of abnormal vessels.
- Neovascularisation: A choroidal neovascularization (CNVM) appears during the choroidal flush as a lacy pattern of vessels that leak profusely in the late phase. However, they may be often missed in case there is an overlying hemorrhage and may only show late leakage at the borders of such hemorrhage. A retinal neovascularisation appears as lacy vessels on the surface of the retina that fluoresce early and show profuse leakage in the late phase.
- Collaterals and Shunts: In case of a vascular shutdown, collaterals (vein to vein) and shunts (artery to vein) form and need differentiation from new vessels. These never leak on an angiogram.
- Telengiectasias, micro or macroaneurysms, Lebers’ miliary aneurysms all show early hyperfluorescence and late leakage and can be picked up easily on an angiogram.
9. Corresponding the findings on angiogram with the fundus picture:
Last but probably one of the most important things while reading the angiogram is the correspondence of the FFA findings with the clinical fundus picture which gives the exact interpretation of the investigation. This holds true for all investigations!
10. Reporting Angiogram findings:
A good understanding of the angiogram will aid in reporting an angiogram well. Most of the angiograms can be reported in this basic prototype
- Arm to Retina time (normal/delayed)
- AV transit time (normal/delayed)
- Foveal avascular zone - size and shape (enlarged/broken)
- Abnormal Fluorescence areas and their course in the late phase (like capillary non-perfusion areas, microaneurysms, etc)
- Late phase findings: leakage/ staining especially of the disc.