
WHO (ICD-10) defines low vision as“A person who has impairment of visual functioning even after treatment and/ or standard refractive correction, and has a visual acuity of less than 6/18 to light perception, or a visual field less than 10 degrees from the point of fixation, but who uses, or is potentially able to use, vision for the planning and/ or execution of a task for which vision is essential”
NPCB (National Program for Control of Blindness) defines low vision as “Visual acuity of less than 6/18 but equal to or better than 6/60 in the better eye with available correction or a visual field loss of less than 10° from the point of fixation”, and, blindness as “Visual acuity less than 6/60 in the better eye or a corresponding visual field loss of less than 10°
The goal of low vision assessment is to:
- Address the visual demands of the patient
- Identify and evaluate the cause of low vision
- Assess ocular health
- Emphasize the need for the patient/ beneficiary
- Clinical Assessment
- Maintain and improve visual function
- Optometric rehabilitation & intervention
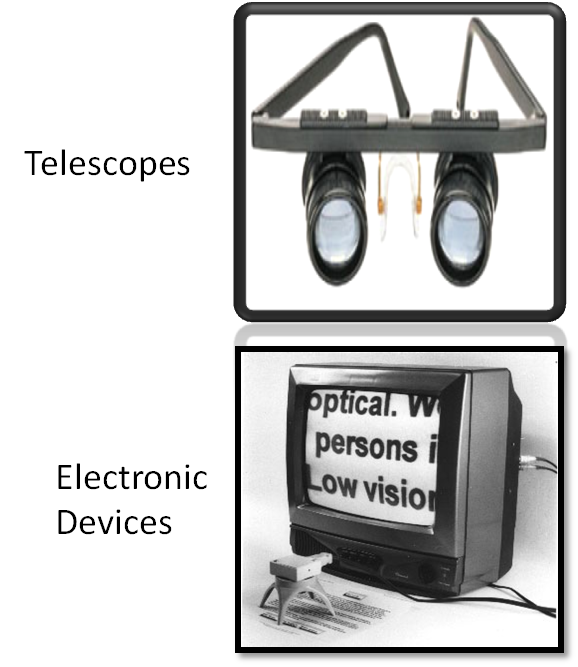
- Improve performance using low vision aids (LVA) and rehabilitative strategies
- Counselling and Education of family, teachers and others.
The complete low vision assessment involves:
- History
- Visual Acuity
- Refraction
- Contrast Sensitivity
- Colour Vision
- Glare Sensitivity
- Visual Feilds
Ocular history:
- Cause of low vision
- The onset of vision loss (gradual/sudden)
- Status (stable/progressive)
- Medical, surgical and laser treatment
- Family history: Consanguinity, RP, myopia
Vocational and lifestyle history:
Questions regarding low vision-related health requirements should be asked in detail:
- Reading and Near Vision:
- Does the patient need or wish to read specific materials, newsletter, newspaper or their mail?
- Intermediate Activities:
- Can the patient see to perform other near point and intermediate visual activities like writing, sewing, cooking, and viewing the computer?
- Activities of Daily Living:
- Can the patient see to do other routine housekeeping duties like cleaning, washing
- Vocational:
- Is the patient employed or doing volunteer work?
- What type of work was done in the past and did the patient leave their job because of their vision problems?
- Is the patient now seeking employment?
- Educational:
- Are there any specific educational needs?
- History of using LVDs/ glasses
- Type
- Whether self-purchased or prescribed
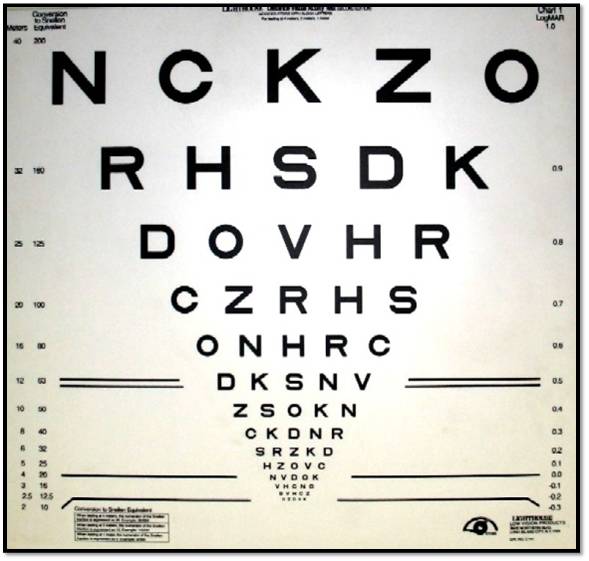
Visual acuity:
Distance acuity:It gives a baseline to monitor the pathology, but also helps to predict the magnification level of the optical devices. It is also essential to establish legal blindness, driving privileges, job eligibility etc.
- Performed at a distance of 10 ft
- The most commonly used charts are:
1) Bailey-Lovie log MAR charts
2) Early Treatment Diabetic Retinopathy Study charts
3) University of waterloo charts.
4) LogMAR chart
Characteristics of these charts:
- Five letters per row and each row has letters of equal difficulty to read.
- Consistency in spacing between letters and lines
- Size progression of letters is logarithmic
- More reliable
- LogMAR chart is considered to be ideal as there is a uniform progression of letter sizes with a standardized separation of letters.
Bailey-Lovie log MAR charts:
- The charts come as a set of two panels (21x24inches, 53x60cm)
- There are 14 rows with a range of sizesfrom 38 to 1.9 M-units.
- Sizes are given in Snellen units for a 6-meter viewing distance.
ETDRS Chart
- Specific design criteria to make it more accurate. These includes:
- The same number of letters per row (five letters per row)
- Equal spacing of the rows and letters on a log scale (the rows are separated by 0.1. log unit)
ETDRS Chart
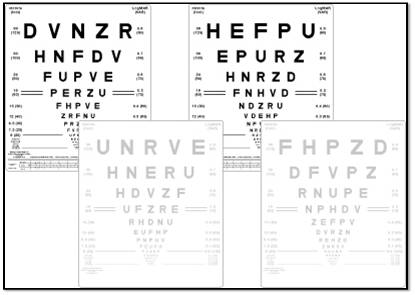
Bailey-Lovie log MAR charts
Optokinetic Drum Test:
- Use to predict the presence of functional acuity.
- A brisk response from 1-3 ft can be interpreted as the potential for some functional vision.
- Response at 5 ft is an excellent prognosis for visual functioning.
Specific activities customized as per the need of the profession of the patient should be checked.
- Blackboard/TV for school going children
- Recognising faces or reading bus number or metro stations for adults
- Photophobia from sunlight, glare from car light in night must be recorded
- Need for different lights in different environments must be checked for proper low vision aid trial
- Mobility must be noted; if the patient is independent or requires support in familiar or unfamiliar locations
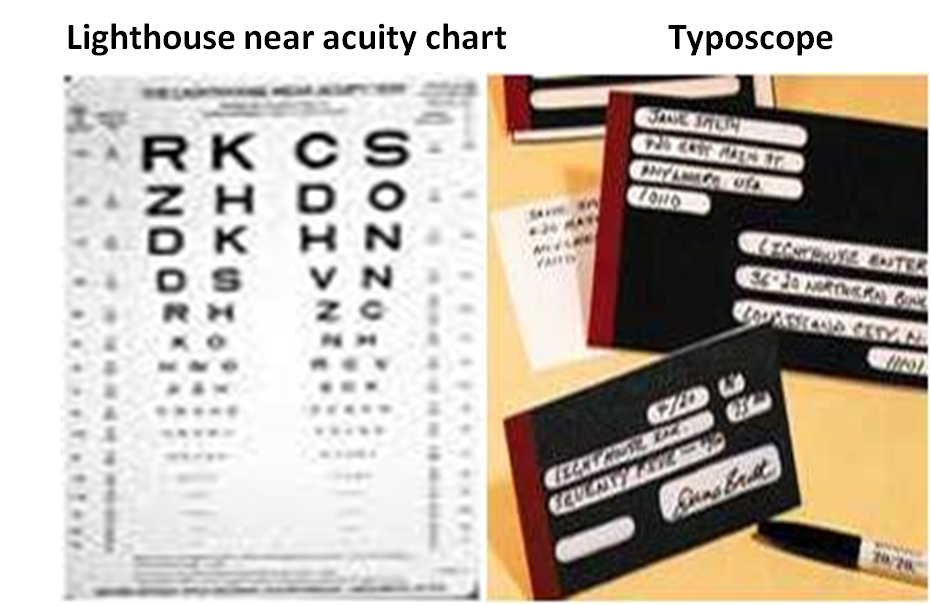
Near acuity:
- It is tested with Lighthouse near acuity charts
- It provides a starting point for near point magnification
- Initially to start with this chart is read at 40 cm distant
- Magnification is represented by formula M =D/2.50 D, or every 2.50 D equals 1X magnification.
- A typoscope (reading slit) should also be demonstrated when measuring near acuities.
- A typoscope is a small black card with a rectangular window cut out of it.
- If the typoscope improves the patient’s acuity, the patient may have an eccentric viewing problem or this patient may require high contrast
Refraction:&Retinoscopy:
All visually impaired patients should undergo refraction to ensure optimal correction for achieving best-corrected visual acuity. Most low vision devices are used in conjunction with refractive correction. The presence of uncorrected presbyopia or significant uncorrected refractive error could affect success with low vision devices.
Retinoscopy:
Retinoscopy is a most useful tool for refraction for low vision, especially if the patient is a poor responder.
- The objective is more reliable than subjective.
- Radical retinoscopy - performed at 25cm or 50 cm when media is not clear.
- NO phoropters, large-aperture full-frame trial lenses preferred
- Mono-ocular and binocular vision assessment should be done
- Prism –in patients with a central scotoma.
Magnification associated with low vision system:
The basic property of magnification is that it is a ratio.
Retinal image magnification (RIM) : is product of 3 factorsRIM = (RSM)(RDM)(LVM)
Where RSM is Relative Size Magnification, RDM is Relative Distance magnification & LVM is Lens Vertex Magnification
- Relative size magnification (RSM) :
- Enlarging the physical size of an object keeping at the same distance.
- Relative distance magnification (RDM) :
- Moving the object closer to the eye causing a proportional enlargement of the retinal image.
- Lens vertex magnification (LVM) :
- The magnification that depends on the kind of lens that is placed before eye & its location.
Magnification for near:
Magnification for distance:
Power of reading distance:
P = 1/F
- Where P is the power of the lens in diopters
- F is the focal length of the lens in meters.
- If power is known we can calculate the focal length.
- E.g. power of lens = +4D
Then its FL = 100/4 = 25cms. I.e 0.25m
Formula 1:Required add =Denominator of patient distance VA /Denominator of desired Near VA X +2.50
e.g. Distance VA = 20/200 and patient wants to read 1M, where 1M = 20/50
So, take both denominator 200/50 X + 2.50 = 4 X +2.50 = + 10.00 D
Formula 2:Kestenbaum's formula: Near Addition =1/Distance VA
e.g. patient’s distance VA 20/160, Then, addition =![]()
Amount of magnification can also be calculated based on the present visual acuity and the required visual acuity
(a) If VA is measured in a LogMAR notation:
Magnification = (1. 25)n Where n = number of steps
If the present acuity = 0.5 and the required acuity = 0.1 Then Magnification = (1.25)4 = 2.44x
(b) Magnification required = Required VA / Present VA
In Snellen notation to improve from 6/60 to 6/6 Magnification required = 6 x 60 / 6 X 6
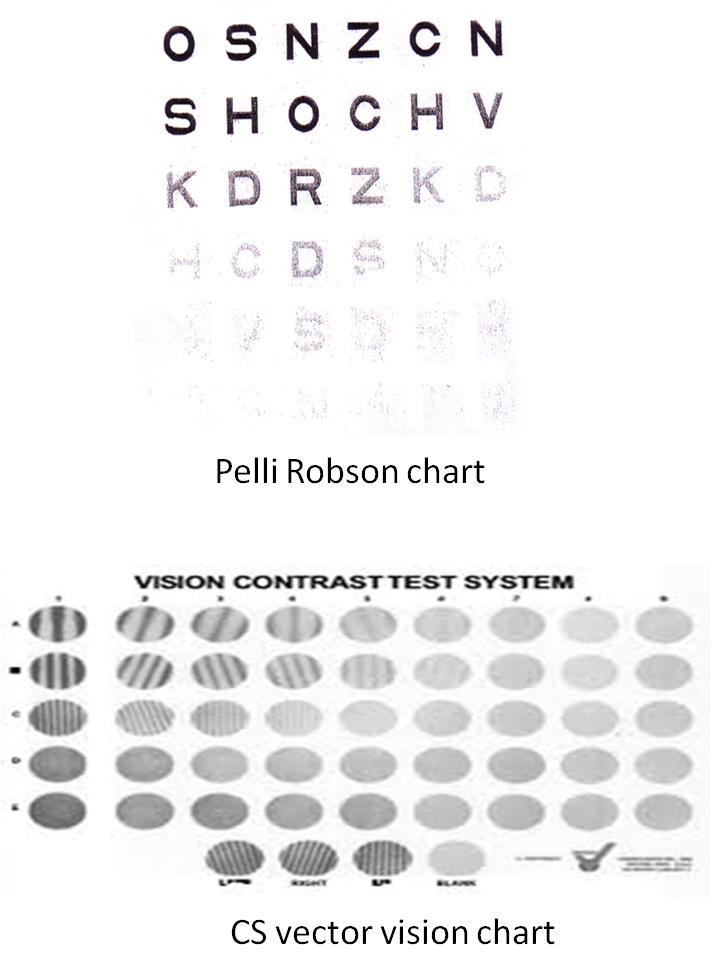
Contrast Sensitivity:
The ability of eye to perceive the smallest luminance difference between the object and its surroundings
It is determined by measuring the contrast thresholds of alternating light and dark bars (the grating).
Several charts are available for contrast sensitivity testing :
- Pelli-Robson Chart
- Hiding Heidi contrast test chart
- Lea contrast flip chart
- Bailey Hi-Low contrast acuity charts
- Vistech 6500 contrast test
- CS vector vision chart
Pelli Robson chart:
- Determines the contrast required to read large letters of a fixed size.
- Read at one meter
- The contrast varies while the letter size remains constant
- Very practical in terms of time and cost
Vistech 6500 contrast test and CS vector vision chart:
- Measure high, medium, and low-frequency losses of contrast.
- More diagnostic than others
- Performed at 1 m to ensure a good response.
A patient with low contrast acuity will have to be prescribed a low vision aid with higher than expected magnification, higher illumination and/ or absorptive filters or typoscopes.
Another effective contrast enhancer is a piece of yellow filter paper placed over the print or yellow clip-on filters over the patient’s spectacles. Yellow filters tend to make the print look blacker.
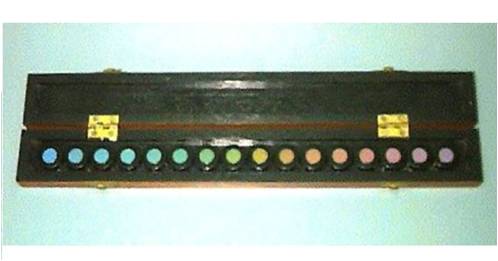
Colour Vision:
- Acquired: mostly blue-yellow defects
- Hereditary: may also be present and unrelated to current illness
For patients with low vision, the Farnsworth-Munsell D15 is a good choice as:
- It is more informative than most screening tests
- Relatively quick
- Easy to administer.
- In this test, 15 coloured discs are arranged by hue. The pattern of variation from normal provides information as to the type of colour deficiency.
Other method of colour vision testing are Ishihara’s Pseudoisochromaticcolor plates, or by asking the patient to discriminate, match or sort out various colour threads or buttons.
Glare:
Light is scattered between source and retina causing
- Discomfort glare
- Disability glare
Causes
- Rod monochromatism
- Posterior capsular opacification
- Corneal opacities glaucoma
- Lasered proliferative diabetic retinopathy
- Congenital cataract
- Albinism
- Aniridia
Testing glare acuity signifies the need to add filters or contrast enhancers to improve the distance vision. Glare disability can be tested objectively by using glare acuity tester and autorefractors, or subjectively by patients’ complaints, comparing the visual acuity with or without illumination in vision chart. Brightness acuity testing should be done in patients complaining of glare. Photochromatic glasses are prescribed for patients with debilitating glare
Visual field:
The size and location of the scotoma can affect reading ability, despite appropriate magnification and visual acuity improvement. Visual field assessment is important for orientation, mobility training, to guide patient for preferred retinal fixation or environmental modifications.
The confrontation method for gross field defect is evaluated followed by central and peripheral visual field testing.
Central visual field testing:
Amsler grid test:
The purpose of the test is to plot areas of significant visual loss within the central 20° of the visual field.
- To determine the quality of the patient’s central vision or the perimacular area to be used for magnification and eccentric viewing.
- To determine functional information rather than disease information.
- The test is undertaken at 30 cm (1/3 meter) with the opposite eye closed.
- Reading glasses or bifocals are used
- The patient fixates only on the central spot of the Amsler grid card and reports the absence and/or distortion of the surrounding straight lines of the grid pattern,
Peripheral visual field testing:
Standardized visual field testing, such as automated Humphrey perimetryor Goldmann visual field testing would be employed if screening reveals suspected visual field losses.
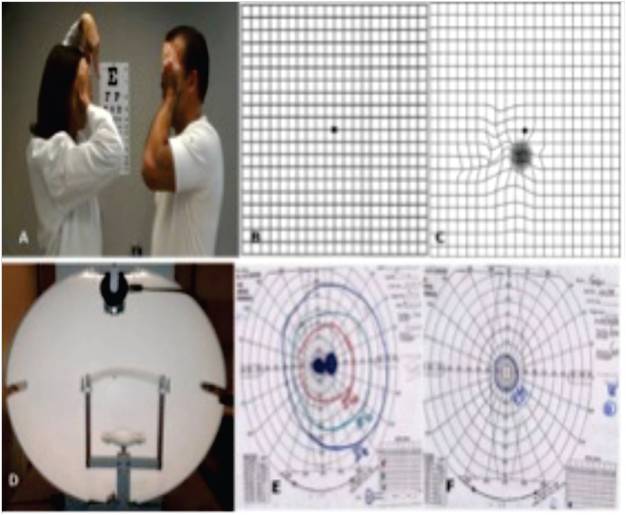
Visual field assessment in a patient with low vision. (A) Confrontation method for the visual field; (B) Amsler grid; (C) Amsler grid depicting metamorphopsia; (D) Goldman perimeter; (E) Goldman visual field – central scotoma; (F) Goldman visual field – Tunnel vision.
Ocular Motility and Binocular Vision Assessment
Gross assessment of ocular alignment, binocularity, and stereopsis is needed.
Electrophysiological tests (Electroretinogram (ERG), electro-oculogram (EOG), Visually Evoked potential (VEP))
It is very helpful in patients of cortical blindness, LCA, mentally retarded patients, infants or kids where the visual acuity cannot be estimated subjectively and has a poor visual prognosis
Ocular Health Assessment
- External examination (adnexa, lids, conjunctiva, cornea, iris, lens, and pupillary responses)
- Biomicroscopy (lids, lashes, conjunctiva, tear film, cornea, anterior chamber, iris, and lens)
- Tonometry
- Central and peripheral fundus examination under dilated pupils, unless contraindicated
Clinical pearls for low vision assessment and prescription:
- Visual acuity: record the smallest letter size read and the test distance.
- Metric reading is the notation used in low vision documentation
- Binocular testing (VA, Amsler, CS) indicates the effect of pathology and dominant eye on binocular response
- Contrast sensitivity: predict the need for higher magnification, increased illumination and contrast
- Brightness acuity testing is recommended when presenting complaint is glare
- The outcome is to enhance an individual`s ability to function independently
- Instructing the patient in the use of prescribed devices
- Matching device and task
- Providing information to patient and family or others are essential steps in low vision care
- Follow- up a program
- Referral to other services